Welcome to the JavaScript feedback portal. We’re happy you’re here! If you have feedback on how to improve the JavaScript, we’d love to hear it!
Thanks for joining our community and helping improve Syncfusion products!
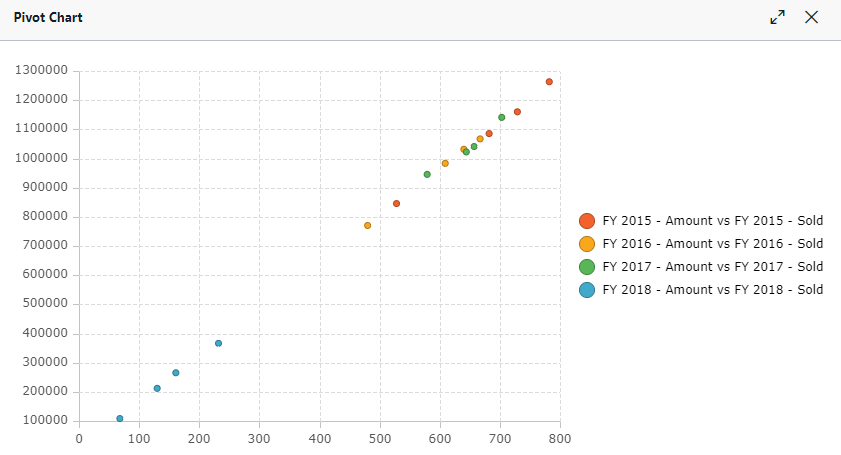
In the pivot table, we can render pivot chart based on the pivot report bound to it. Currently we have support to render following chart types.
Column
Line
Spline
Bar
Area
StepArea
SplineArea
StackingColumn
StackingArea
StackingBar
StepLine
Pareto
Bubble
Scatter
StackingColumn100
StackingBar100
StackingArea100
Polar
Radar
Pie
Doughnut
Funnel
Pyramid
And we need to include "Scatter (XY) Plot" as chart type to the Pivot Table component.
Reference:
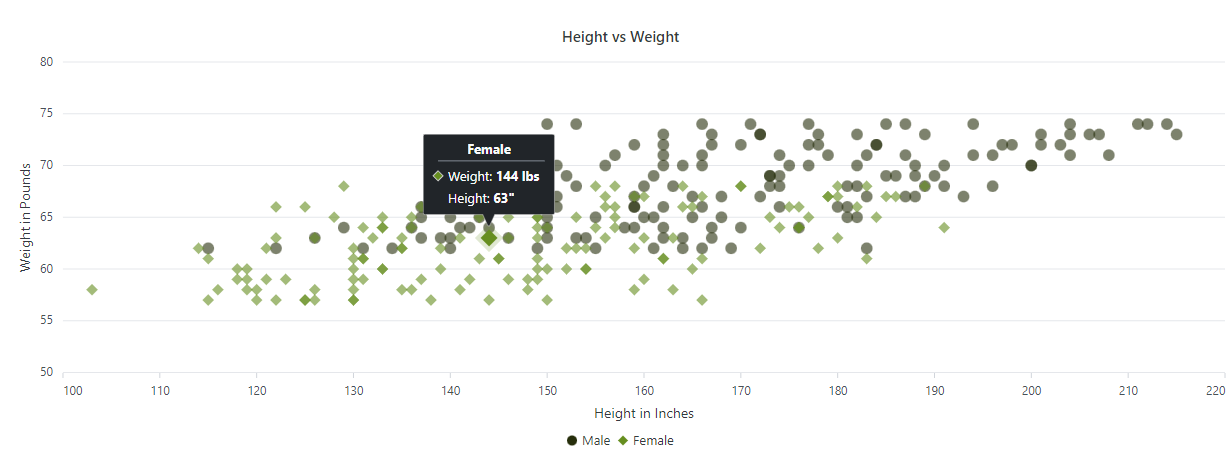
Demo: https://ej2.syncfusion.com/javascript/demos/#/bootstrap5/chart/scatter-plot.html
 Bold BI
 Bold Reports
 BoldDesk