Welcome to the Blazor feedback portal. We’re happy you’re here! If you have feedback on how to improve the Blazor, we’d love to hear it!
Thanks for joining our community and helping improve Syncfusion products!
Hello,
I can't get tooltips to appear on charts at all.
After several searches, I see that I'm not the only one having this problem ... And that when you try our piece of code it works for you ...
I even tried to just copy paste your examples like here: https://blazor.syncfusion.com/documentation/chart/tool-tip, into a new blank project but that doesn't work either!
Here is my example code :
@using System.Globalization;
@using Syncfusion.Blazor.Charts;
@page "/ConsoTest"
<div class="control-section">
<SfChart @ref="SfChartObject" Title="Consommation" Palettes="@palettes">
<ChartArea><ChartAreaBorder Width="0"></ChartAreaBorder></ChartArea>
<ChartPrimaryXAxis ValueType="Syncfusion.Blazor.Charts.ValueType.DateTime" LabelFormat="MMMM yy" IntervalType="IntervalType.Months" EdgeLabelPlacement="EdgeLabelPlacement.Shift">
<ChartAxisMajorGridLines Width="0"></ChartAxisMajorGridLines>
<ChartAxisLabelStyle Size="10px"></ChartAxisLabelStyle>
</ChartPrimaryXAxis>
<ChartPrimaryYAxis LabelFormat="{value}" Minimum="0">
<ChartAxisLineStyle Width="0"></ChartAxisLineStyle>
<ChartAxisMajorTickLines Width="0"></ChartAxisMajorTickLines>
</ChartPrimaryYAxis>
<ChartTooltipSettings Enable="true"></ChartTooltipSettings>
<ChartSeriesCollection>
<ChartSeries DataSource="@ChartDataEF" Name="Cold water" XName="Period" Width="2"
Opacity="1" YName="Conso" Type="ChartSeriesType.Line" LegendShape="LegendShape.Circle">
<ChartMarker Visible="true" Width="10" Height="10">
</ChartMarker>
</ChartSeries>
<ChartSeries DataSource="@ChartDataEC" Name="Hot water" XName="Period" Width="2"
Opacity="1" YName="Conso" Type="ChartSeriesType.Line" LegendShape="LegendShape.Circle">
<ChartMarker Visible="true" Width="10" Height="10">
</ChartMarker>
</ChartSeries>
</ChartSeriesCollection>
</SfChart>
</div>
@code {
public SfChart SfChartObject;
public String[] palettes = new String[] { "#5e9cff", "#ff5e5e", "#75f1ff", "#ffb663", "#de7aff" };
public List<LineChartData> ChartDataEF = new List<LineChartData>();
public List<LineChartData> ChartDataEC = new List<LineChartData>();
protected override void OnInitialized()
{
double consoEF = 0;
double consoEC = 0;
for(int i = 1; i<=9; i++)
{
ChartDataEF.Add(new LineChartData { Period = DateTime.ParseExact("20200" + i + "01", "yyyyMMdd", CultureInfo.InvariantCulture), Conso = consoEF });
consoEF = GetRandomNumber(consoEF, consoEF + 100);
ChartDataEC.Add(new LineChartData { Period = DateTime.ParseExact("20200" + i + "01", "yyyyMMdd", CultureInfo.InvariantCulture), Conso = consoEC });
consoEC = GetRandomNumber(consoEC, consoEC + 100);
}
}
private double GetRandomNumber(double minimum, double maximum)
{
Random random = new Random();
return random.NextDouble() * (maximum - minimum) + minimum;
}
public class LineChartData
{
public DateTime Period { get; set; }
public double Conso { get; set; }
}
}
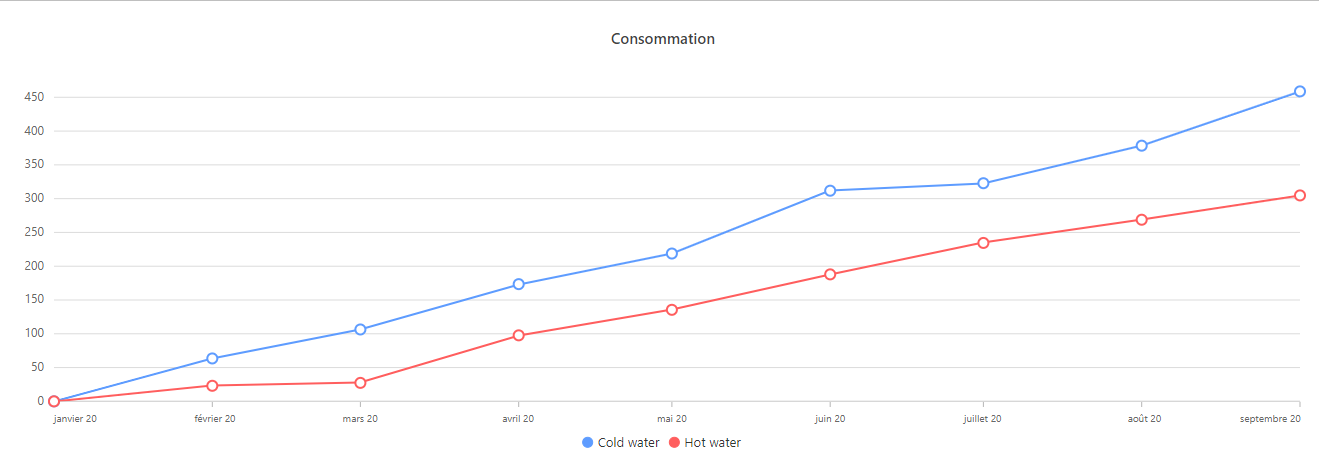
Here is the result (mouse is over point, no tooltip) :
Thanks in advance for your help.
 Bold BI
 Bold Reports
 BoldDesk