Welcome to the Angular feedback portal. We’re happy you’re here! If you have feedback on how to improve the Angular, we’d love to hear it!

  • Check out the features or bugs others have reported and vote on your favorites. Feedback will be prioritized based on popularity.
  • If you have feedback that’s not listed yet, submit your own.

Thanks for joining our community and helping improve Syncfusion products!

2
Votes

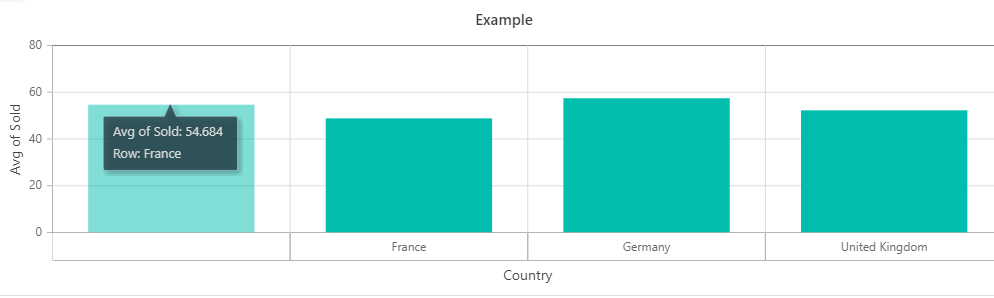
We have noticed an issue when using the Chart view of a Pivot Table when the rows have a value with a blank label. The chart only shows the data for the rows with a non-blank label, but the axis shows the blank label and the labels on the axis are off by one.

Please see the following example. In this example, I have replaced the "Country" value for the first data point with an empty string instead of "France".

  1. Navigate to: https://stackblitz.com/edit/pivot-chart-blank-column?file=app.component.ts
  2. Click Field List icon.
  3. Drag Country to the Rows axis and Sold to the Values axis.
  4. Click Apply
  5. Chart displays.Note that despite there being 5 distinct "Country" values (empty string, France, Germany, UK, and US) there are only 4 columns. The labels on the x axis show the first 4 values: empty string, France, Germany, UK. However the first column is actually France's data, the second is Germany's, etc. There is no column foe the empty string. The tooltip when hovering over the column actually does show the correct name of the country, which doesn't match the axis label.
Empty


Please let me know if you have any questions on the issue or how to reproduce.