---
title: "What’s New in .NET MAUI Charts: 2022 Volume 3"
published_at: "2022-10-13T11:30:57+00:00"
modified_at: "2025-03-21T10:45:39+00:00"
url: "https://www.syncfusion.com/blogs/post/whats-new-in-net-maui-charts-2022-volume-3"
excerpt: "The .NET MAUI Charts control is a well-crafted charting control for visualizing data. It contains a rich gallery of 10+ charts and graphs that cater to all charting scenarios. In this blog post, I’ll quickly introduce the new features included..."
taxonomy_category:
- ".NET MAUI"
- "Chart"
- "Desktop"
- "Mobile"
- "Syncfusion"
- "What's new"
taxonomy_post_tag:
- ".NET MAUI"
- "Charts"
- "desktop"
- "Mobile"
- "What's New"
---
# What’s New in .NET MAUI Charts: 2022 Volume 3
[Saravanan Madheswaran](https://www.syncfusion.com/blogs/author/saravanan-madheswaran)
The [.NET MAUI Charts](https://www.syncfusion.com/maui-controls/maui-charts)
control is a well-crafted charting control for visualizing data. It contains a rich gallery of 10+ charts and graphs that cater to all charting scenarios.
In this blog post, I’ll quickly introduce the new features included in the .NET MAUI Charts control for the [2022 Volume 3](https://www.syncfusion.com/forums/177858/essential-studio-2022-volume-3-main-release-v20-3-0-47-is-available-for-download)
release.
## Logarithmic axis
When the largest and smallest values in a data collection are hundreds or even thousands of units apart, the logarithmic scale can be used to describe the data interval.
Our Syncfusion .NET MAUI Charts now support rendering a logarithmic axis. It can compactly display numerical data over a large range of values.
The following code example shows how to configure a logarithmic axis in a .NET MAUI Cartesian Chart.
**Xaml**
```
```
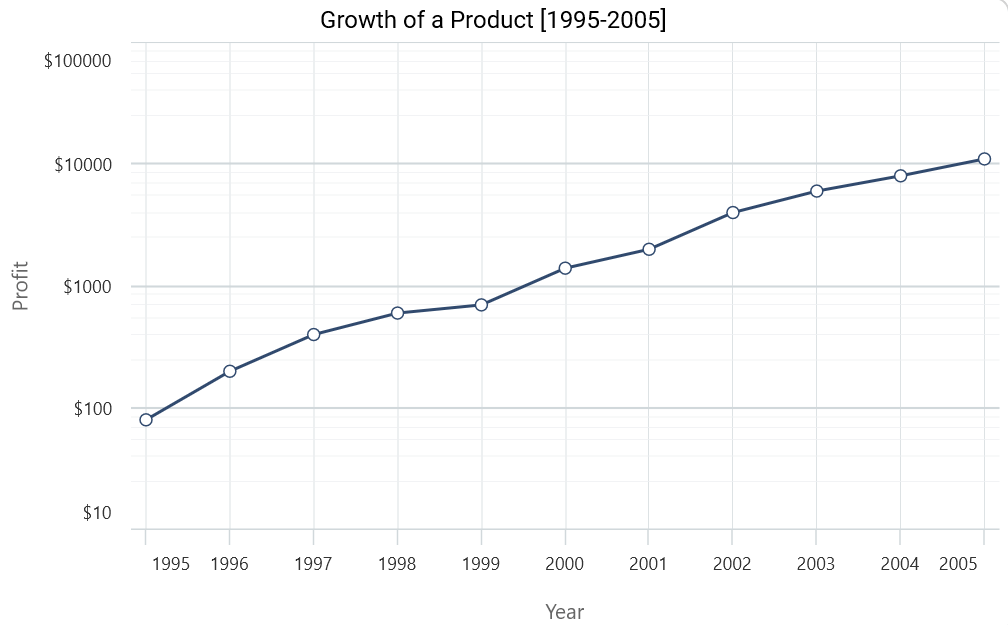
Logarithmic axis support in .NET MAUI Charts
## Series selection and multiselection
The .NET MAUI Charts control’s selection behavior highlights a particular element [data point or series] on the chart. In other words, this behavior selects a segment or series.
The following code shows how to configure series selection in a chart.
**Xaml**
```
. . .
```
And the next code shows how to enable the selection of multiple series in .NET MAUI Charts.
**Xaml**
```
. . .
```
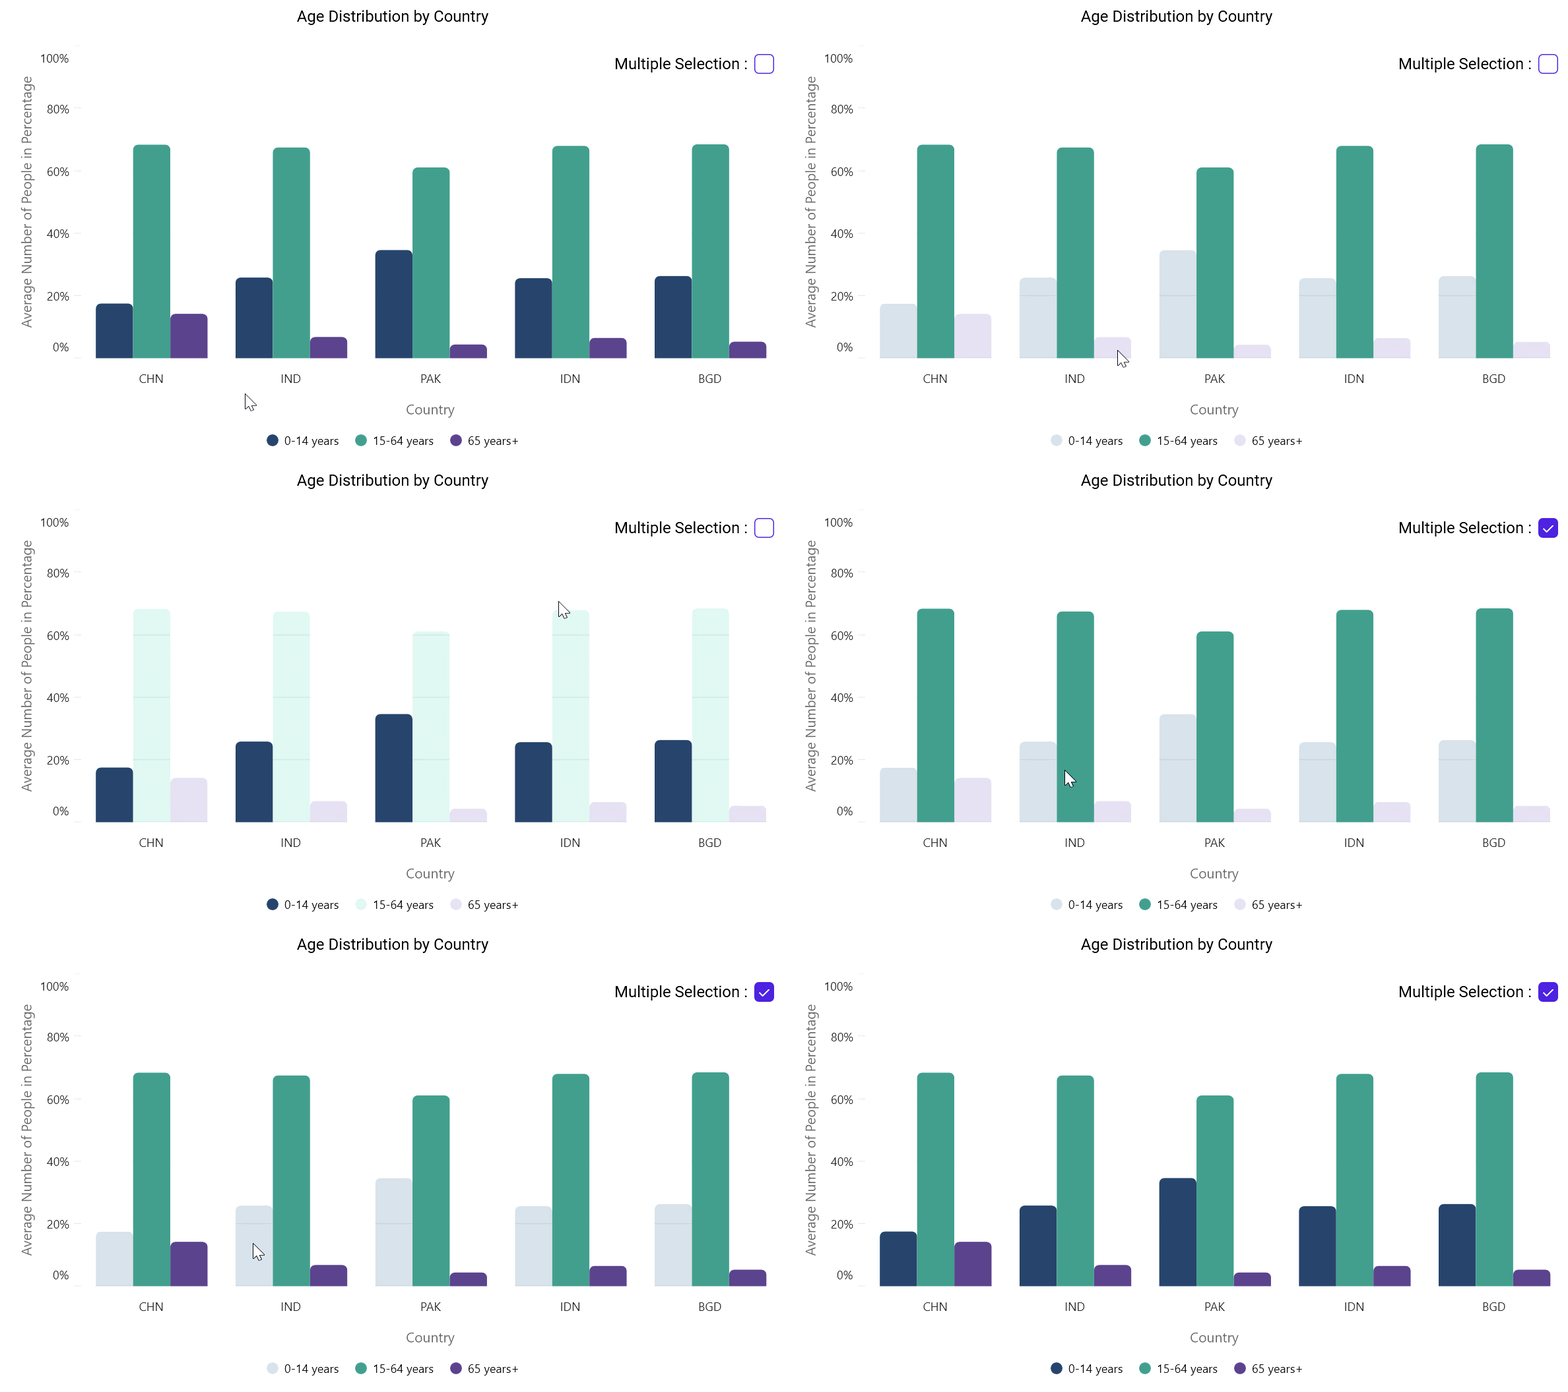
Series selection and multiselection feature in .NET MAUI Charts
## Explode segment on touch
Now, you can pop out a particular segment of a circular chart (pie and doughnut) with a touching or tapping interaction. The following code example shows how to configure a segment to explode on touch.
**Xaml**
```
. . .
```
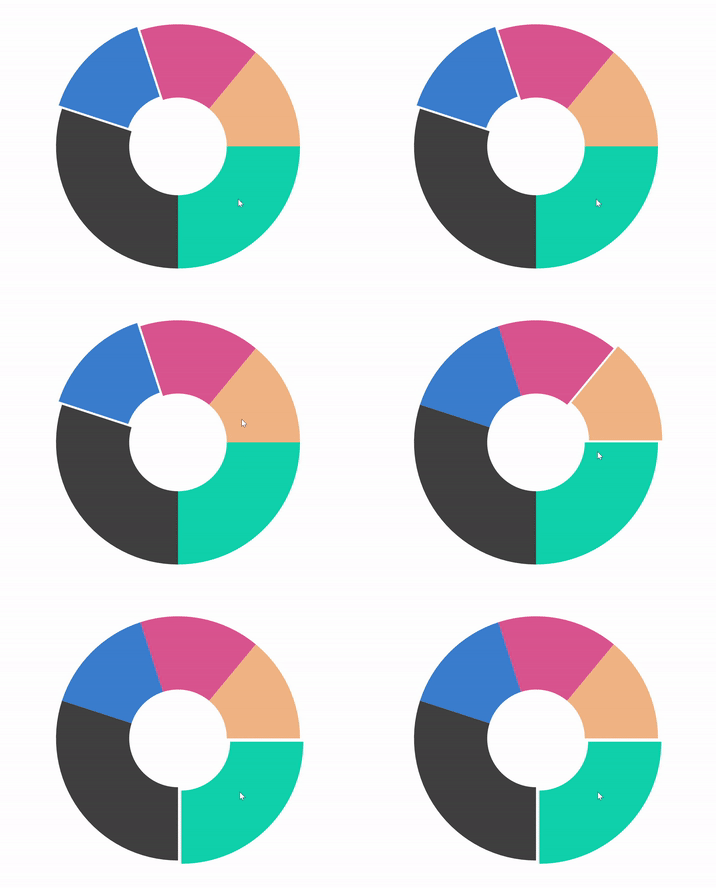
Explode a segment using touch interaction in .NET MAUI Circular Chart
## View in center of doughnut charts
You can place any view in the middle of a doughnut chart. This helps us show more information about the chart data. The following code example shows how to configure the doughnut chart’s center view.
**Xaml**
```
```
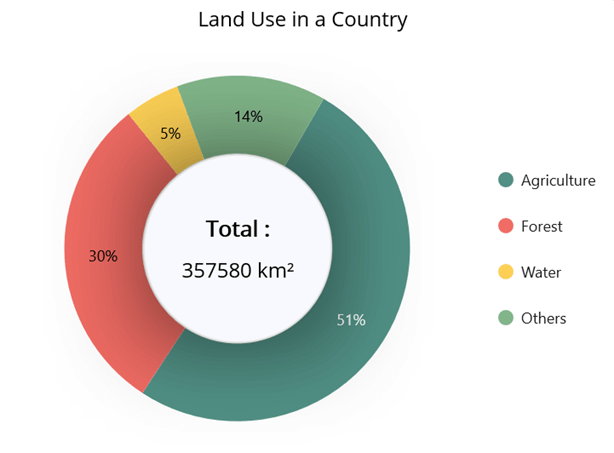
Adding a View at the Center of a .NET MAUI doughnut chart
## Chart plot area background
Add any view to the chart area. This comes in handy for including relevant information, a watermark, or a color gradient in the chart’s background area.
The following code example shows how to configure the .NET MAUI Cartesian Chart’s plot area background view.
**Xaml**
```
```
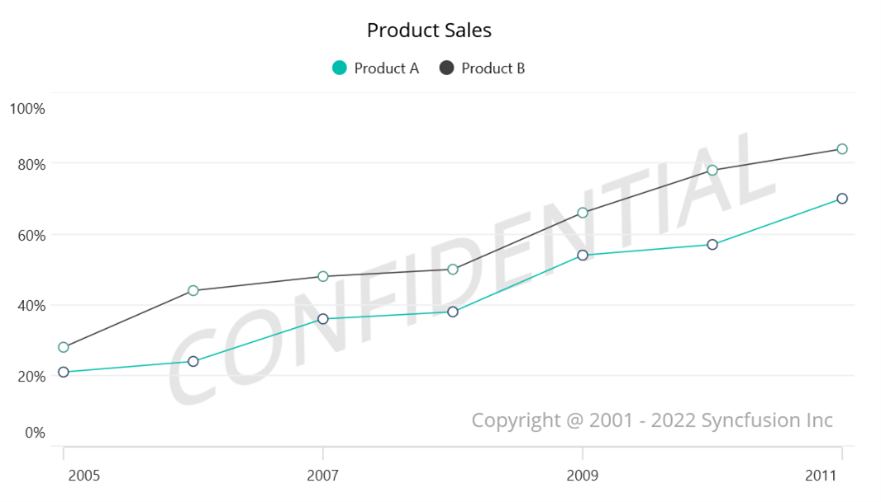
Adding a view at the chart plot area background
## Conclusion
Thanks for reading! We have seen the new features added to the Syncfusion [.NET MAUI Charts](https://www.syncfusion.com/maui-controls/maui-charts)
for the [2022 Volume 3](https://www.syncfusion.com/forums/177858/essential-studio-2022-volume-3-main-release-v20-3-0-47-is-available-for-download)
release. Use these features to make your chart data more readable.
You can get additional details about every new feature in this Volume 3 by reading our [release notes](https://help.syncfusion.com/common/essential-studio/release-notes/v20.3.0.47?_gl=1*1yl54py*_ga*MTc0OTQ0NjYwNi4xNjU3ODgyMjE1*_ga_WC4JKKPHH0*MTY2NTExMDM1Ny4zMTYuMS4xNjY1MTExNjY5LjAuMC4w)
and [What’s New](https://www.syncfusion.com/products/whatsnew)
pages. Have a look at our .NET MAUI Charts [GitHub demos](https://github.com/syncfusion/maui-demos)
and [documentation](https://help.syncfusion.com/maui/introduction/overview)
.
Submit your questions or feature requests in the comments section below. You can also reach us through our [support forums](https://www.syncfusion.com/forums)
, [support portal](https://support.syncfusion.com/)
, or [feedback portal](https://www.syncfusion.com/feedback/)
.
## Related blogs
- [Syncfusion Essential Studio®2022 Volume 3 Is Here!](https://www.syncfusion.com/blogs/post/syncfusion-essential-studio-2022-volume-3-is-here.aspx)
- [Introducing the .NET MAUI Autocomplete Control](https://www.syncfusion.com/blogs/post/dotnet-maui-autocomplete-control.aspx)
- [What’s New in .NET MAUI: 2022 Volume 3](https://www.syncfusion.com/blogs/post/whats-new-in-net-maui-2022-volume-3.aspx)
- [Configure Syncfusion .NET MAUI Controls Using Visual State Manager (VSM)](https://www.syncfusion.com/blogs/post/configure-syncfusion-net-maui-controls-using-visual-state-manager.aspx)