
Introduction
We are happy to announce that our JavaScript Pivot Table has been updated to its final version. In this blog post, we are going to explore the following major features included in this 2018 Volume 4 release:
- Editing
- Drill-through
- Additional aggregation types
- Defer layout update
- Hyperlink
- Show/hide grand totals and subtotals
Final version of the Pivot Table and new features are also available in Angular, React, Vue, ASP.NET Core, and ASP.NET MVC.
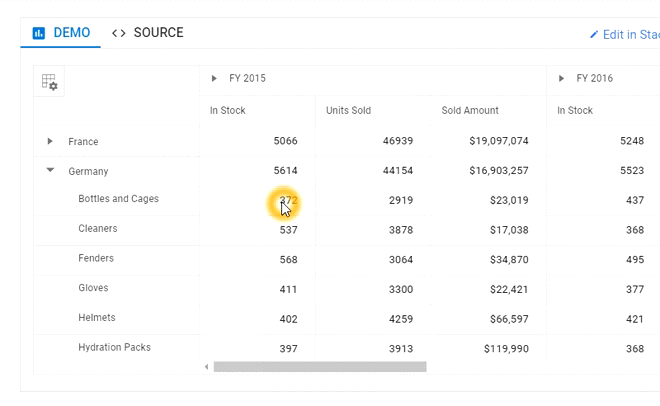
Editing raw items
Editing helps users when applying predictive analytics to their instinct value. Our JavaScript Pivot Table allows you edit raw items directly in a flat/data grid. Users can create, read, delete, and update a record in the raw data source for any pivot summarized cell. In the editing operation, the engine automatically recalculates the pivot data and reflects that change in the JavaScript Pivot Table.
Double-click any pivot cell and it will show a built-in dialog with raw data for the corresponding pivot cell. Double-click any cells in the flat grid from the built-in dialog to edit the data. When you finally update the edited data, the pivot table engine will automatically recalculate the pivot data and reflect it in the view.
There are four types of editing options: inline, batch, dialog, and column. For more details, refer to the documentation.
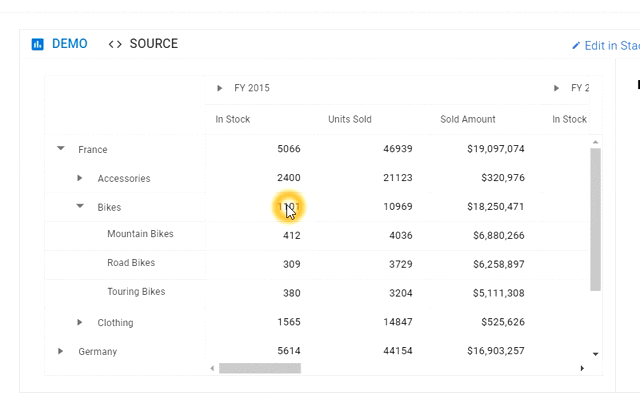
Drill-through
Drill-through is a powerful feature used for analysis perspective that provides the ability to see data in a detailed manner. In other words, it shows the raw data of any aggregated value.
You can view the raw items of any pivot cell by double-clicking the cell in the JavaScript Pivot Table. The built-in dialog will be opened. It holds the row headers, column headers, and value information of the clicked cell along with raw data. Refer to our documentation for more details.
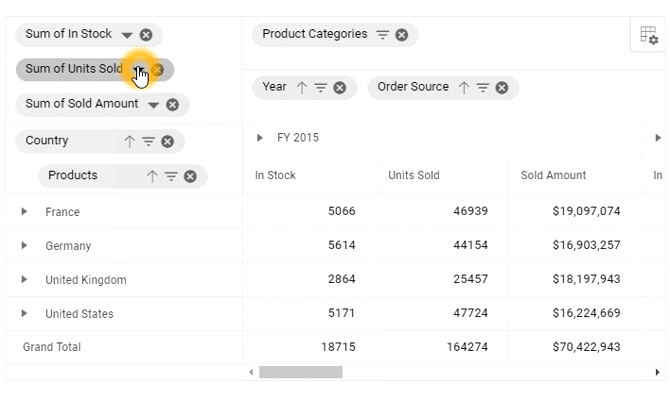
Advanced aggregation types
We have provided additional aggregation types for better analysis of business data in different scenarios. Newly included types are distinct count, product, index, population stdev, sample stdev, population var, sample var, running totals, difference from, % of difference from, % of grand total, % of column total, % of row total, % of parent total, % of parent column total, and % of parent column total.
We have also provided an option to change the aggregation type through UI interaction for every measure item in the grouping bar and pivot table field list. It helps users change the aggregation type dynamically. Click here to view our documentation on changing the aggregation type.
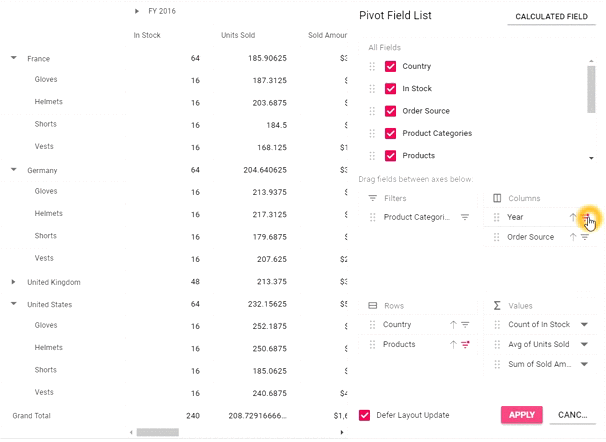
Defer layout update
In general, pivot users experience problems while working with big data, as each report operation takes additional time to update the pivot table. To avoid this, we have introduced a defer layout update option to refresh the JavaScript Pivot Table on-demand, similar to the Microsoft Excel pivot table.
When users try to remove or add multiple fields in a report, they may encounter the pivot table updating after each change. But now, users can update the pivot table after performing all changes in the report for a better experience. Users can easily enable or disable this option with UI provision in the field list. Refer to this link for documentation.
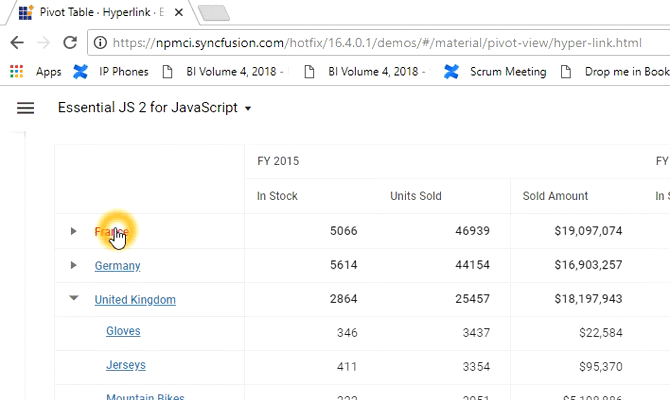
Hyperlink
Users can navigate to the desired page or perform custom operations with cell information when clicking a hyperlink cell.
Users can avail themselves of various options to enable hyperlinks for specific cells. Hyperlink options can be applied for all cells, row headers only, column headers only, value cells only, summary cells only, condition-based options, and for specific row/column headers. Click to learn more about hyperlink settings.
Show hide totals
We have provided an option to display a JavaScript Pivot Table without any grand total or subtotals. Similarly, users can avoid any specific row/column grand total or subtotals for a specific field.
Totals can be disabled by setting an API in the pivot report, and the pivot table will render the data without calculating the total cell. For more details, refer to the documentation.
What’s Next
If you are an existing customer, please download the new version from the download page and try this new widget and its features for yourself. If you are a new customer, you can try our 30-day free trial to experiment with this new widget.
Please let us know in the comments section below if you have any questions. You can also contact us through our support forum or Direct-Trac.
If you like this post, we think you’ll also enjoy the following:
- [Blog Post] Creating a Meeting Room Calendar Using the Syncfusion JavaScript Scheduler
- [Blog Post] File Explorer in JavaScript
- [Ebook] JavaScript Succinctly
- [Ebook] React.js Succinctly
- [Ebook] Node.js Succinctly


