Data visualization is a crucial part of modern web applications. With various visualization techniques, everyone tries to make their application unique and appealing to users. As developers, knowing how to deliver these customer needs is essential.
In this article, I will discuss eight JavaScript data visualization libraries every developer should know.
1. D3.js
D3.js is a popular JavaScript data visualization library used in web development. It allows you to visualize document-based data using HTML, CSS, and SVG. D3.js gives complete freedom to the developer to design the perfect interface for data while utilizing the full capabilities of modern browsers. D3.js has more than 1.9 million weekly NPM downloads and 103K+ GitHub stars.
Features
- Includes support for declarative and data-driven programming.
- Enhances user experience by supporting animations, interactions, and data-driven charts.
- Simple customizations.
- Lightweight and fast.
- Good community support.
Installation
You can easily install D3.js using NPM or Yarn as follows:
// Using NPM
npm inst d3

// Using Yarn
yarn add d3
You can find a working demo of D3.js with Angular on Stackblitz.

2. Chart.js
Chart.js is an open-source, community-maintained JavaScript data visualization library for making HTML-based charts. It allows developers to easily add dynamic and interactive graphs to applications with large data quantities. It is used by companies like Google and The New York Times in their interactive infographics. Chart.js supports only HTML5 Canvas. However, it can be viewed on any platform or web browser without having Flash or other plugins. Chart.js has more than 2.1 million weekly NPM downloads and 58K+ GitHub stars.
Features
- Excellent rendering and performance across all modern browsers.
- Responsive since it adjusts the chart to fit the window.
- Provides eight chart types.
- Various performance improvements have been introduced with version 3.
- Detailed instructions with simple-to-follow examples.
Installation
You can easily install Chart.js using NPM as follows:
// Using NPM
npm install chart.js
You can find a working demo of Chart.js with Angular on Stackblitz.
3. Highcharts
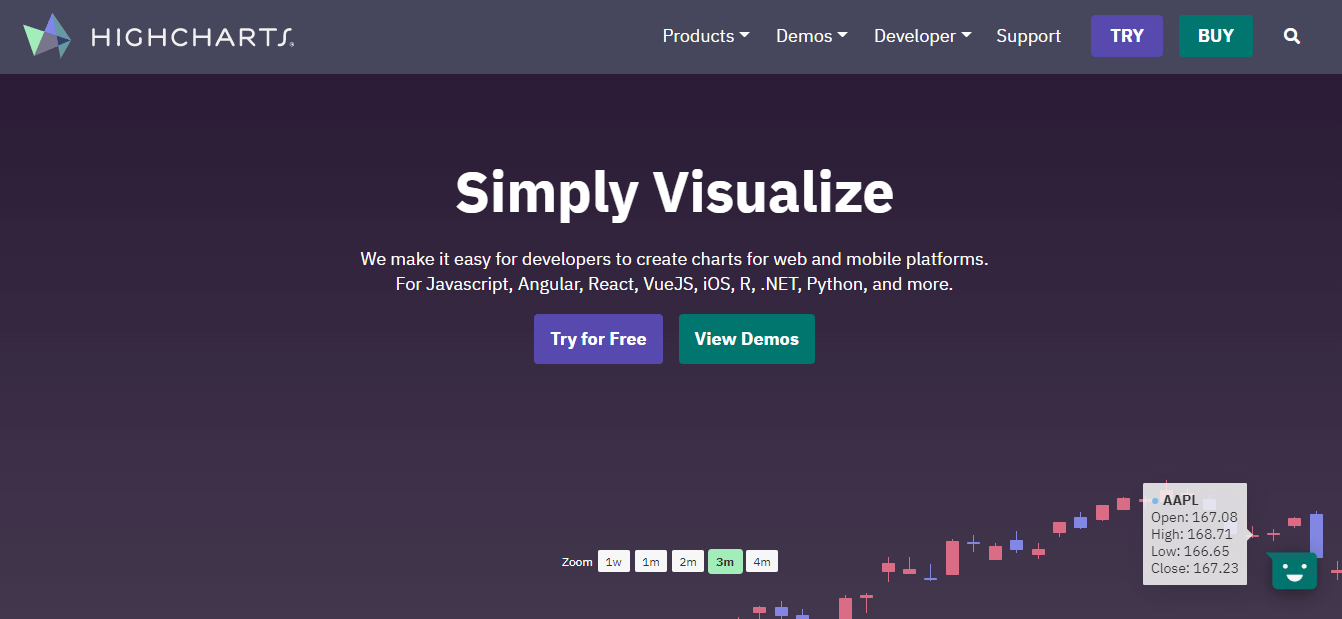
Highcharts is a famous data visualization library that has been around for several years. All current web browsers, including Chrome, Safari, Firefox, Opera, IE7+, and iOS, support Highcharts. In addition to the simple charts, you can use Highcharts to create stock charts, Gantt charts, and charts based on maps. Highcharts has more than 1 million weekly NPM downloads.
Features
- Supports a variety of online and mobile platforms.
- Supports data export and import.
- Supports numerous axes, tooltip labels, and external data loading.
- Provides a variety of configurations and modifications.
- Suitable with all current mobile and online browsers.
Installation
You can easily install Highcharts using NPM or Yarn as follows:
// Using NPM
npm install highcharts

// Using Yarn
yarn add highcharts
You can find a working demo of Highcharts with Angular on Stackblitz.

4. Recharts
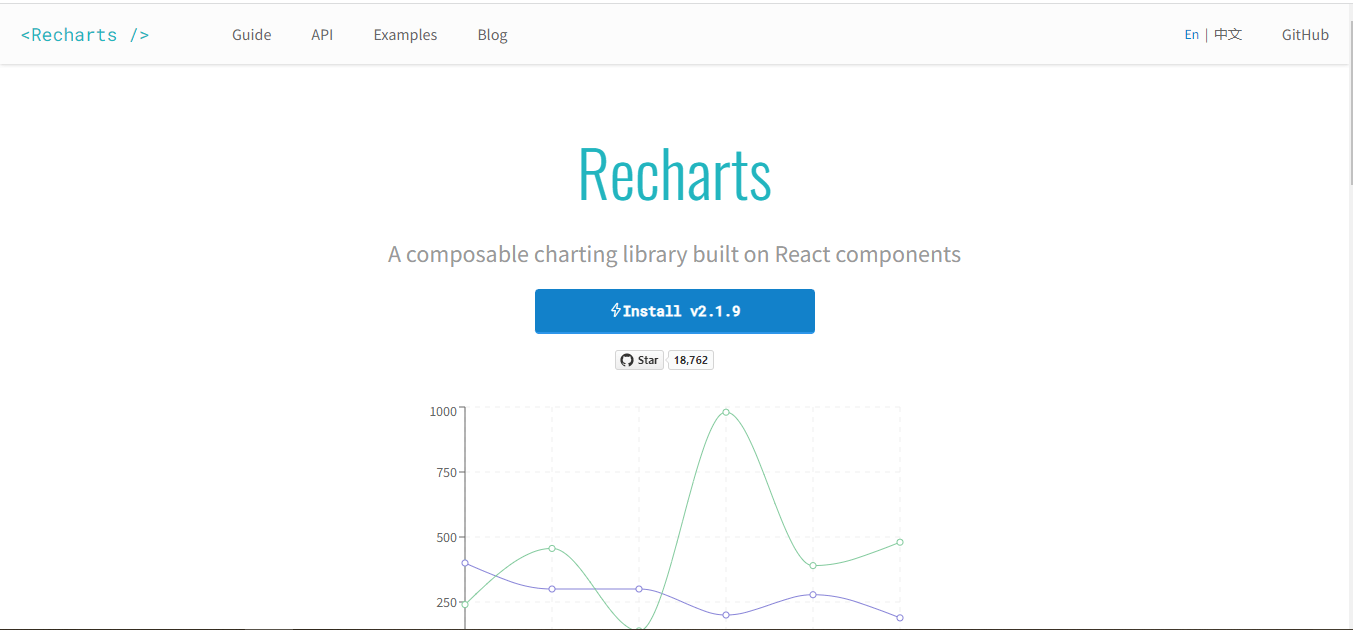
Recharts is a data visualization library created using React and D3. It was primarily designed to use with web-based data applications. But now, it provides fantastic features to visualize data compared to other solutions. For example, it can render items with many information panes on the same chart and crosshairs to track values on pointer movements over data plots, data labels, data callouts, and data ranges. Recharts has more than 1.1 million weekly NPM downloads and 18.9K+ GitHub stars.
Features
- Native SVG support.
- Lightweight.
- Support for declarative building blocks.
- A simple API.
- Excellent chart customization options.
Installation
You can easily install Recharts using NPM or Yarn as follows:
// Using NPM
npm i recharts

// Using Yarn
yarn add recharts
You can find a working demo of Recharts with React on Stackblitz.
5. Flexmonster
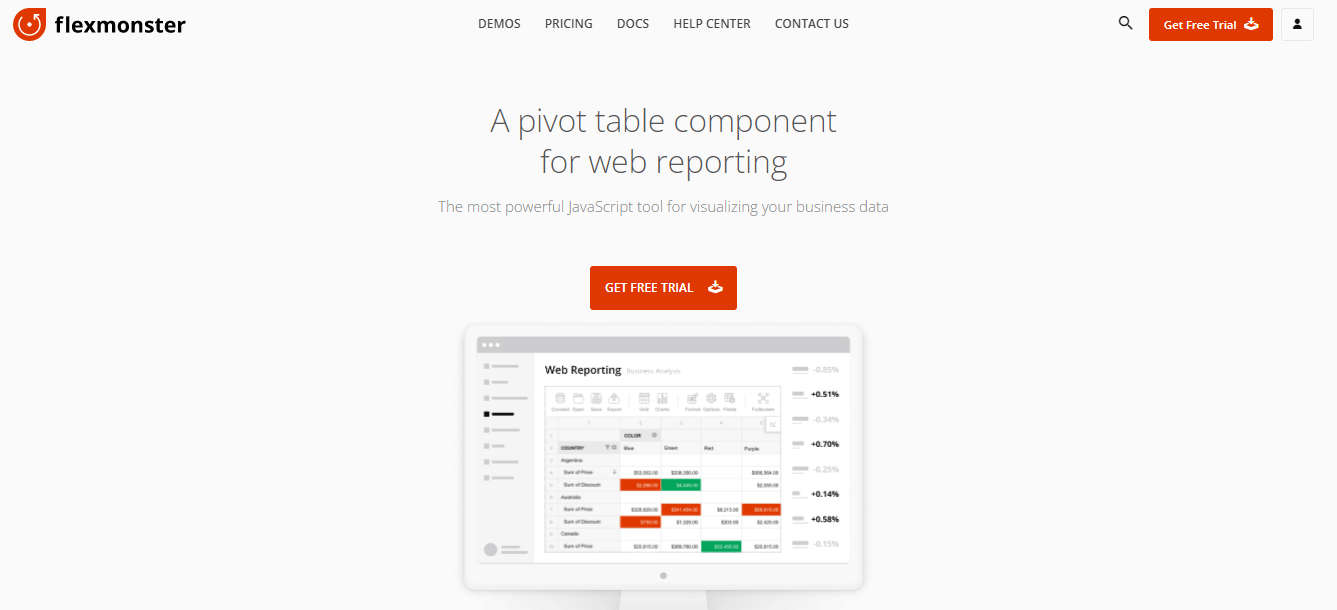
Flexmonster is a JavaScript library for data visualization and reporting. It provides a simple and intuitive API for creating interactive reports and dashboards with support for a wide range of data sources, including CSV, JSON, Excel, and SQL databases. Flexmonster also provides a wide range of customization options, including changing the appearance and behavior of reports and dashboards, and adding custom calculations and filters.
Features
- Easy-to-use API.
- Customizable reports and dashboards.
- Support for multiple data sources (CSV, JSON, Excel, SQL).
- Cross-platform compatibility.
- Scalable design.
Installation
You can easily install Flexmonster using NPM, as follows:
// Using NPM
npm i flexmonster
You can find several working examples of Flexmonster with JavaScript, Angular, and React here.
6. Chartkick
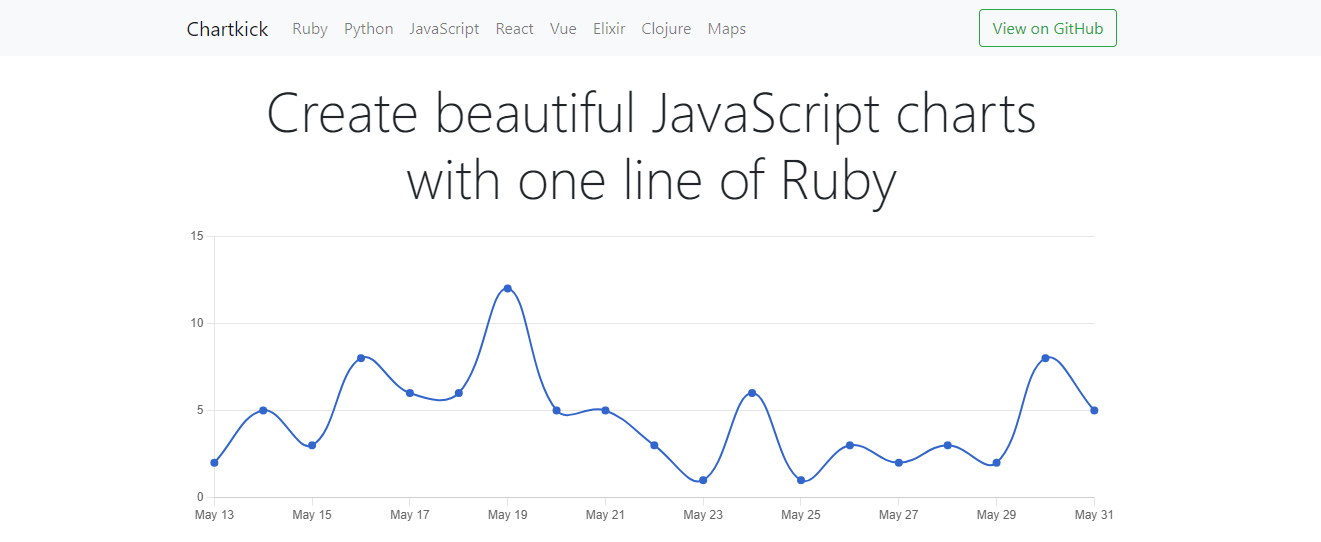
Chartkick is a JavaScript library for easily creating charts and graphs. It provides a simple API for creating various charts, including line, bar, pie, and more. Chartkick integrates with popular JavaScript charting libraries such as Highcharts, Chart.js, and Google Charts, making it easy to get started with data visualization. Chartkick has more than 1.2K GitHub stars and 70K+ weekly NPM stars.
Features
- Simple integration with popular frameworks (Ruby on Rails, Sinatra, etc.).
- A wide range of chart types (line, bar, pie, etc.).
- Dynamic updates without page refreshing.
- Support for multiple data formats (CSV, JSON, etc.).
- Customizable options (colors, labels, etc.).
Installation
You can easily install Chartkick using NPM as follows:
// Using NPM
npm i chartkick
You can find several working examples of Chartkick here.
7. Syncfusion JavaScript Charts
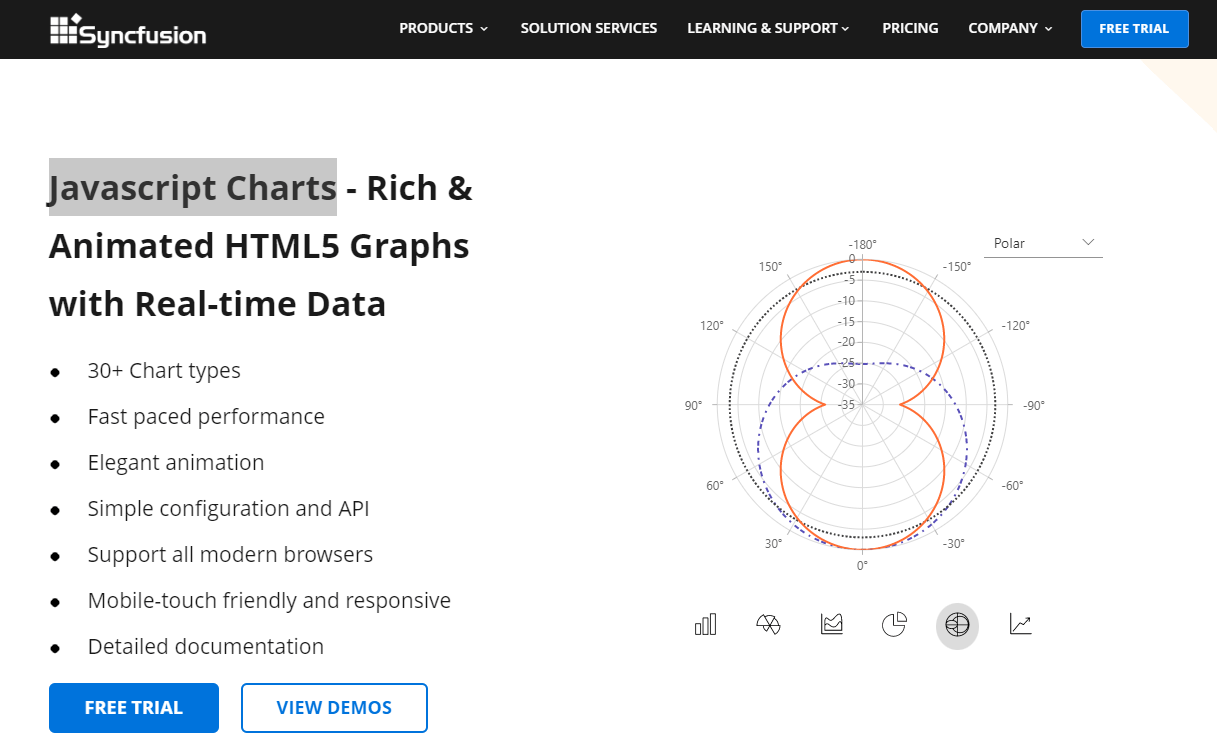
Syncfusion JS charts is another excellent data visualization library for JavaScript projects. It supports more than 30 chart types, including interactive charts, real-time charts, annotation charts, and more. In addition, you can use it with multiple frameworks like Angular, React, Vue.js, ASP.NET Core, etc. Syncfusion JS charts have more than 29,000 weekly NPM downloads.
Features
- Supports 30+ chart types.
- Simple configuration and API.
- Focused on high performance.
- Support SVG rendering.
- Support for all modern browsers.
- Mobile-touch friendly and responsive.
- Support for multiple locales.
- Good documentation.
Installation
You can easily install Syncfusion JS Charts using NPM as follows:
// Using NPM
npm i @syncfusion/ej2-charts
On Syncfusion’s demo page, you can find working examples of all the chart types they support.
8. Victory
Victory is an open-source library for creating data visualizations with React and React Native. It provides a comprehensive set of components for creating bar charts, line charts, scatter plots, and other data visualizations. It also has built-in support for responsive design, tooltips, and animations, making creating dynamic and interactive data visualizations for web and mobile applications easy. Victory has more than 10.2K GitHub stars and 188K+ weekly NPM downloads.
Features
- Support for multiple chart types (bar, line, scatter, etc.).
- Customizable appearance and behavior.
- Animated chart updates.
- Responsive design.
- Works well with React and React Native.
Installation
You can easily install Victory using NPM as follows:
// Using NPM
npm i victory
You can find a working demo of Victory with React on Stackblitz.
Conclusion
In this article, I discussed eight JavaScript Libraries with unique features for data visualization. I hope this list helps you choose your project’s best data visualization library. Thank you for reading!
The Syncfusion JavaScript suite is the only suite you will ever need to build an application. It contains over 80 high-performance, lightweight, modular, and responsive UI components in a single package. Download the free trial and evaluate the controls today.
If you have any questions or comments, you can contact us through our support forums, support portal, or feedback portal. We are always happy to assist you!