The Syncfusion Blazor Gantt Chart is a project management tool that provides a Microsoft Project-like interface for scheduling and managing projects.
Once computers introduced new ways of working, project managers found they could save time creating and updating their Gantt charts. Gantt charts help us to automate this process to support more advanced requirements, like creating task dependencies, adding milestones, or identifying the critical path of a project plan.
In this blog, I’ll talk about the task scheduling and marker features of Syncfusion’s Blazor Gantt Chart.
Task Scheduling
What is scheduling?
Gantt charts show what work is scheduled on a specific day. They also allow you to view a project’s start and end dates along with the progress made. Apart from individual task progress, you can also look at a task’s contribution to the completion of a parent task.
How does scheduling tasks help project planning?
Scheduling tasks is key to forecasting the completion of a project and enhancing communication with a team. Using a Gantt chart is like putting a bridge between your initial project plan and its execution. Gantt charts allow you to set accurate deadlines.
The Gantt Chart control provides different ways to schedule a task to meet any requirement:
Auto-scheduling mode
Syncfusion’s Blazor Gantt Chart is more convenient to handle and add information to. With auto mode, tasks in the Gantt Chart are validated for their start and end date values. These validations are based on child task duration and data value mismatch.
Auto-scheduling mode decreases the time spent planning tasks. Let’s see some examples that clearly explain this mode.
Example 1
new TaskData() {
    TaskId = 5,
    TaskName = "Project estimation",
    StartDate = new DateTime(2019, 03, 29),
    EndDate = new DateTime(2019, 04, 2),
    Duration="4"
}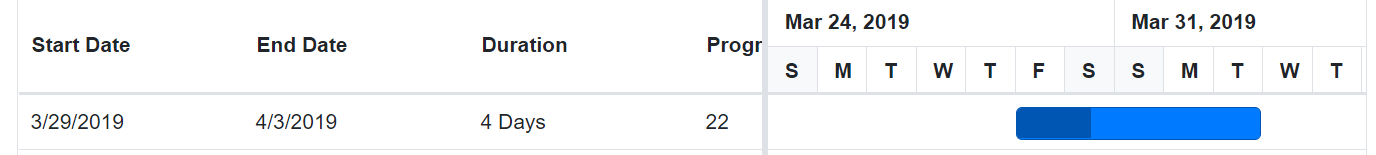
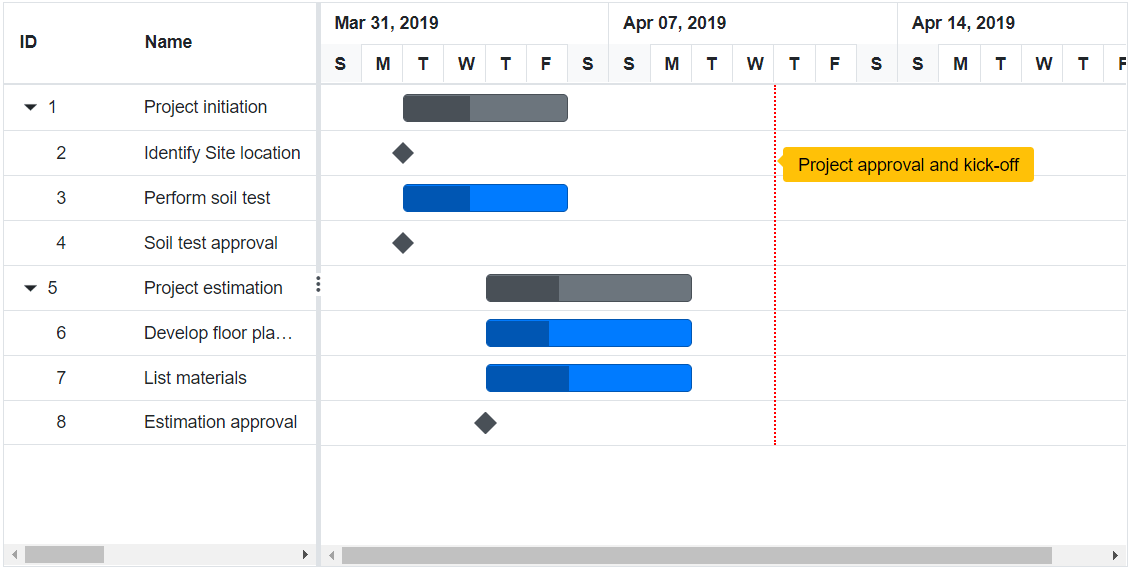
Here the EndDate value in dataSource is on 2 April 2019, yet the taskbar is rendered up to 3 April 2019 since the duration is only four days. Also, considering Saturday and Sunday as non-working days, the end date is auto-validated as 3 April 2019.
Example 2
new TaskData() {
    TaskId = 1,
    TaskName = "Project initiation",
    StartDate = new DateTime(2019, 03, 28),
    EndDate = new DateTime(2019, 07, 28),  // This is end of parent record.
    Duration="4"
},
new TaskData() {
    TaskId = 2,
    TaskName = "Identify Site location",
    StartDate = new DateTime(2019, 03, 29),
    Progress = 30,
    ParentId = 1,
    Duration="2" // Child record duration.
 },
 new TaskData() {
     TaskId = 3,
     TaskName = "Perform soil test",
     StartDate = new DateTime(2019, 03, 29),
     ParentId = 1,
     Duration="4" // Child record duration
 },
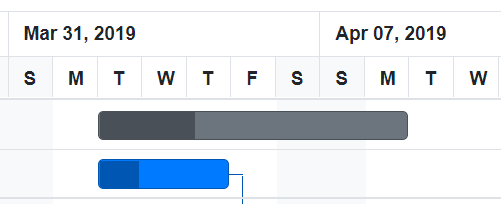
In this example, the end date value of the parent record is 28 July 2019. Yet the parent row’s taskbar is rendered only until 3 April 2019. This is because parent row duration is auto-validated, considering its child-record durations. Since the maximum end date of the child record is 3 April 2019, the end date of the parent record is auto-validated to 3 April 2019.
Manual scheduling mode
The Gantt chart provides an option to auto-validate tasks to optimize task scheduling. We can schedule task dates as planned by the project managers by skipping the optimizations or validations. To do so, we can use the manual mode.
Let’s see an example.
new TaskData() {
TaskId = 1,
TaskName = "Project initiation",
StartDate = new DateTime(2019, 03, 28),
Duration="4"
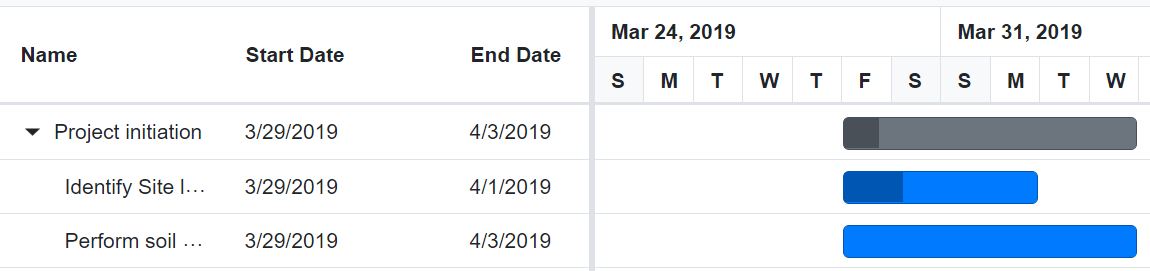
},The parent record’s start and end dates are 29 March 2019 and 31 March 2019, respectively.
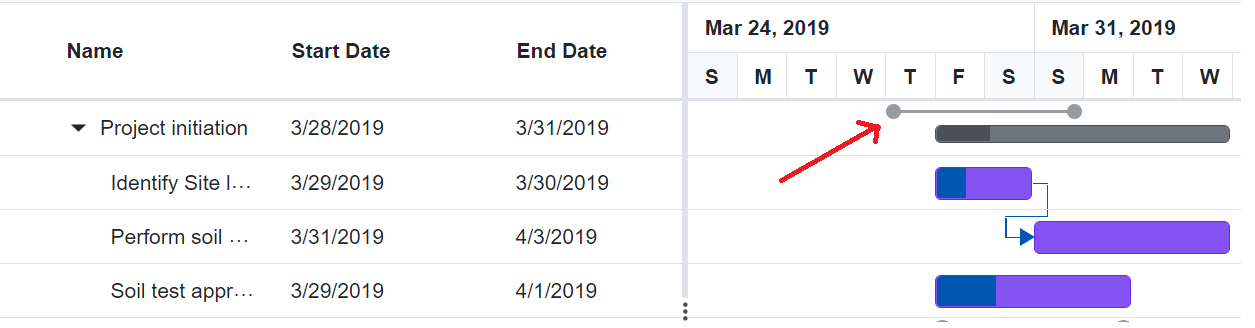
The baseline taskbar, drawn in gray (where the red arrow points), is rendered with values found in DataSource without any validation. Though in manual mode, an auto-validated taskbar will also be rendered below the manually scheduled baseline taskbar.
The previous image shows that the manually scheduled baseline taskbar does not consider weekends, holidays, and child tasks.
Custom
Custom mode is a combination of both auto and manual modes. You can specify which records need to be auto-validated and which ones need to be manually scheduled.
Unscheduled tasks
We may have some uncertain tasks, such as not having a start or end date or not having both date values, which are unscheduled tasks. We can represent these unscheduled tasks by partially rendering the taskbar in the Gantt Chart.
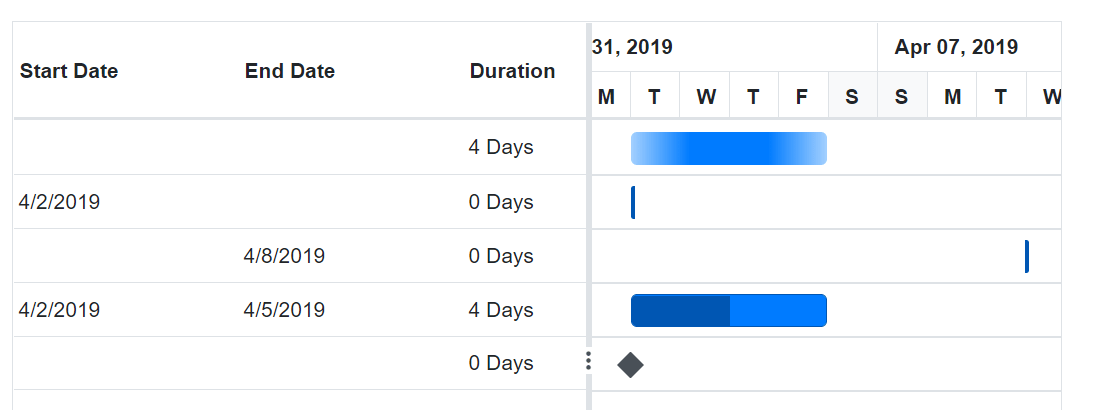
In the previous image:
- The first record has no start and end date; it has only a duration value.
- The second record has only the start date.
- The third record has only an end date.
- The fourth record is a scheduled task.
- The fifth record has no start or end date. And since the duration value is 0, it is marked as a milestone.
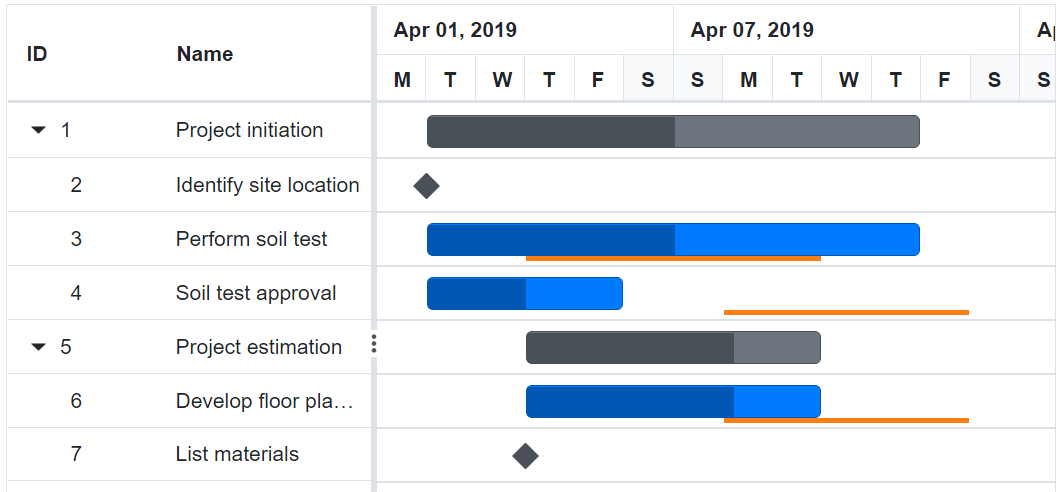
Baseline
To get a better view of a project’s deviation, a baseline works well. It shows the deviation between the planned and actual dates of a project. This feature is beneficial when you need to react quickly to project deviations. We should provide the deviation values along with DataSource to the Gantt control, and the Gantt chart will provide a UI representation of the deviations as taskbars.
Markers
Markers are indicators in the Gantt chart timeline highlighting a task or a specific date.
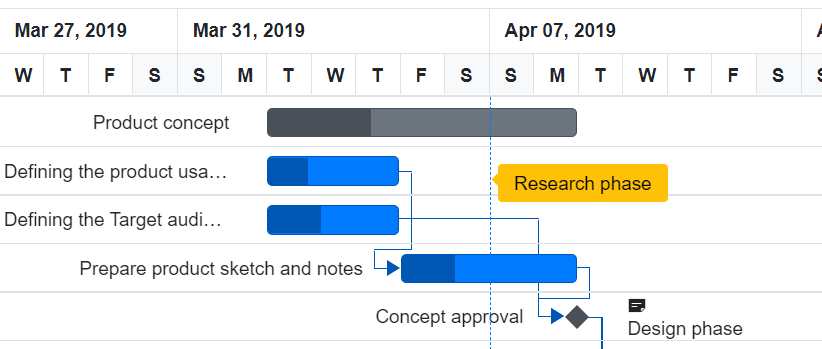
In the previous image, Research phase is a marker that denotes the product analysis that needs to be completed within that timeline.
Why are markers used?
In a large project or resource planning chart, markers highlight key events, deadlines, or reference points.
There are different types of markers to choose from based on the application scenario.
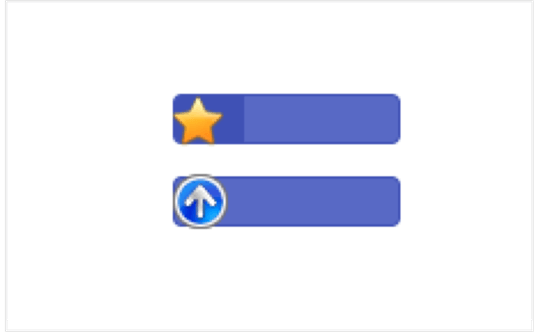
Event markers
A vertical line drawn on a particular timeline in a Gantt chart highlights the entire tasks in a project.
Data markers
Data markers display information in addition to a regular taskbar. We can use them to display a date or any other value.
Holidays
Different localities have different non-working days, and you can map the non-working days on a project timeline in a Gantt chart. This is helpful for task scheduling for working days.
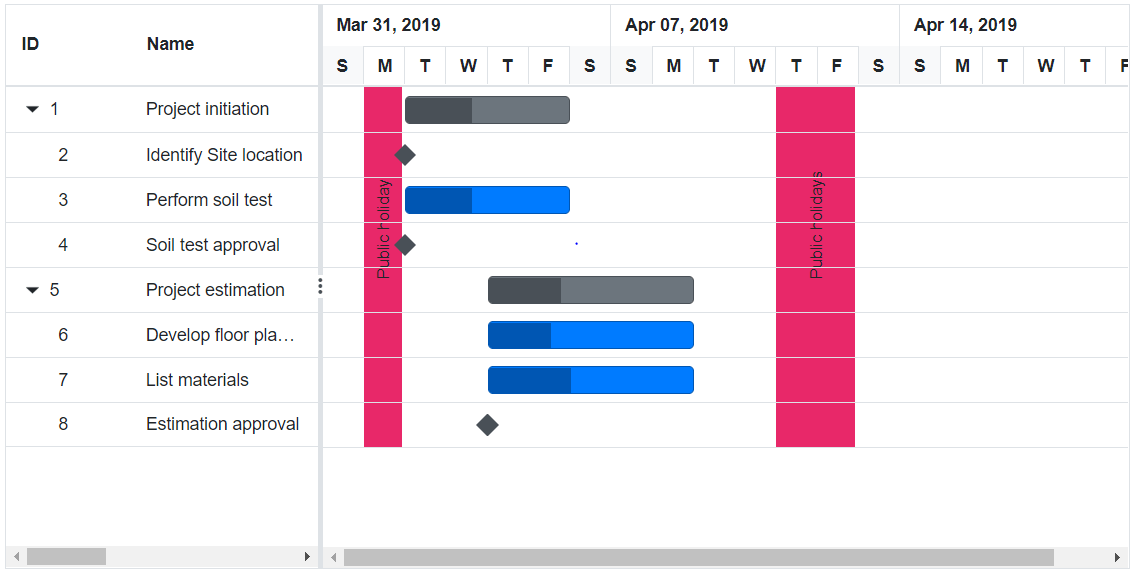
You can also customize weekend holidays in the timeline.
Resources
For more information, refer to the GitHub project called Task Scheduling and Markers in the Blazor Gantt Chart component.

Conclusion
Thank you for reading this blog, where I addressed the Gantt chart’s task scheduling and marker features. For more details, refer to the Blazor Gantt Chart documentation. You can also use the sample uploaded here for better reference.
You can download our free trial if you want to try this Syncfusion component.
Contact us through our support forum, support portal, or feedback portal. We are always happy to assist you!
Related blogs
- Syncfusion Essential Studio 2022 Volume 4 Is Here!
- What’s New in Syncfusion Blazor: 2022 Volume 4
- Implement User Tagging in Blazor Rich Text Editor with Mention Component
- Boosting Performance of Blazor Gantt Chart Using Virtualization