
Resource management is a vital process in every organization. Resources should be allocated in projects effectively and efficiently to achieve the best productivity. Let’s consider human resources, for instance. It requires planning, scheduling tasks, and placing appropriate employees in the right teams at the right time.
Project managers are responsible for allocating employees to projects and continuously monitoring the performance of the teams in completing the projects according to their schedules. It is a challenging task for managers to accomplish without the right tool.
The Syncfusion Gantt Chart perfectly aids in resource management with its clean and accurate visualization to capture all the needed information in a single place. Managers can track work progress and easily notice if any resource was over allocated. Dynamically, managers can distribute new work or change the existing work for a resource. By using UI interaction like drag and drop, managers can easily re-assign work from one resource to another in case of over allocation or change the scheduled work dates.
Let’s see how to get started with the Syncfusion React Gantt Chart control in this blog and the reasons to choose resource view in Gantt Chart for perfect resource management.
Getting started with React Gantt Chart
Setting up the development environment
Step 1: Use the create-react-app NuGet package to create a React application with basic configuration. For this, you need to install the create-react-app CLI using the following command. Execute this command in the terminal in Visual Studio Code.
npm install -g create-react-app |
Step 2: Then, create a new React application using the following command.
create-react-app react-gantt |
Here, react-gantt is the name of the application, though you can name it as you wish.
Step 3: Ensure that your application has been created properly by running it is using the following command.
npm start |
While running this command, the React application will be launched in the browser with the localhost:3000 URL.
Configuring Gantt Chart in a React application
The React application is ready now, and you can configure the Gantt Chart component in it. The Gantt Chart component is available in the @syncfusion/ej2-react-gantt package.
Install this package in your React application. Do this by executing the following command.
npm install @syncfusion/ej2-react-gantt --save |
Themes in Gantt Chart
The following themes are available to paint the Gantt Chart according to your website theme preference:
- Material
- Bootstrap
- Fabric
- High contrast
Gantt Chart has some subcomponents, too. To apply a theme to a component, add the required theme files from the node-modules folder for all the subcomponents.
You can also load it from a single theme file for all the Syncfusion components you’re using. Here, we are going to reference a common theme file for all of them. In this sample, we have added the Material theme in the index.html file.
<link href="https://cdn.syncfusion.com/ej2/material.css" rel="stylesheet">
Initializing Gantt Chart
We have configured the packages and themes to render Gantt Chart in the application, and now we can initialize the component using the following code example in the App.js file.
import * as React from 'react';
import { GanttComponent, ColumnsDirective } from '@syncfusion/ej2-react-gantt';
export default class App extends React.Component {
  constructor() {
    super(...arguments);
	}
  render() {
    return (
      <GanttComponent>
        <ColumnsDirective>
          <ColumnDirective></ColumnDirective>
        </ColumnsDirective>
        <Inject services={[]} />
      </GanttComponent>
    );
  }
 };
Now, the Syncfusion React Gantt Chart component is ready to use.
Why Syncfusion Gantt Chart’s resource view for resource management?
Easy API structure
Easily enable required features for Gantt Chart by using API’s support and it is also possible to change API’s values by externally to make more interactive to the users. Resource view in Gantt Chart, we have introduced a new API to define the Gantt Chart view type, which can be used to easily switch between project view and resource view.
Refer to the following code example.
<GanttComponent dataSource={resourcesData} viewType='ResourceView'
        resourceFields={this.resourceFields} taskFields={this.taskFields}
        height='410px' resources={resourceCollection}>
        <ColumnsDirective>
          <ColumnDirective field='TaskID' visible={false}>
           </ColumnDirective>
          <ColumnDirective field='TaskName' headerText='Name'>
           </ColumnDirective>
        </ColumnsDirective>
</GanttComponent>
Clear visual design
The work and resources can be grouped in a hierarchical visual design to track the work progress of each task. Also, Gantt Chart allows you to display the allocated tasks in a single row as the collapsed state in each resource by setting the enableMultiTaskbar property as true.
Refer to the following code example.
<GanttComponent  dataSource={resourcesData} viewType='ResourceView'
        enableMultiTaskbar= {true} resourceFields={this.resourceFields} taskFields={this.taskFields}>  </GanttComponent>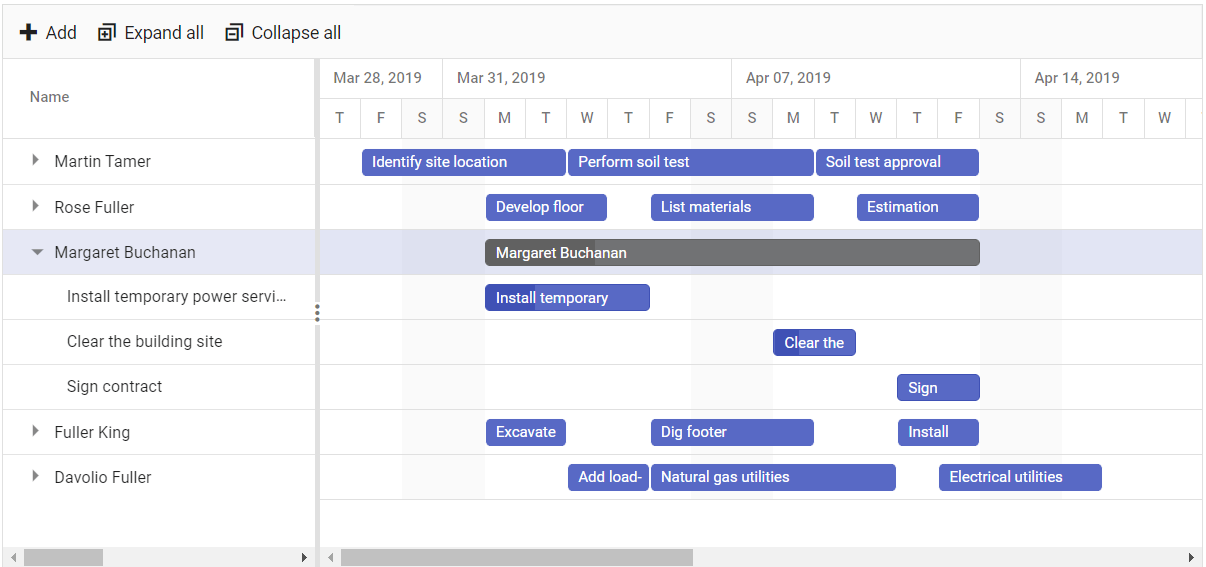
User-friendly UI interaction
You can drag and drop the task row from one resource to another by easily modifying the scheduling value of each task. In that scenario:
- Cell editing support is used to change the specific field value.
- Dialog editing support is used to modify multiple field values at the single database request.
Refer to the following code example.
<GanttComponent viewType='ResourceView' editSettings={this.editSettings} allowRowDragAndDrop={true}
 resourceFields={this.resourceFields} taskFields={this.taskFields} resources={resourceCollection}>
    <Inject services={[Edit, RowDD]} />
</GanttComponent>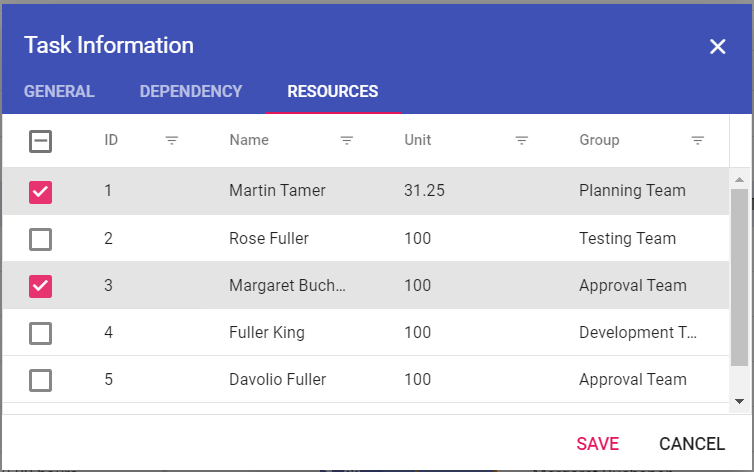
Over-allocation indicator
Resource view in the Gantt Chart highlights the range of days if a resource has been allocated too much work to complete within the resource’s available time. This way, project managers can easily monitor and split the over-allocated work with other resources, which helps them complete their goal at the right time.
Refer to the following code example.
<GanttComponent viewType='ResourceView' showOverAllocation={true}>
</GanttComponent>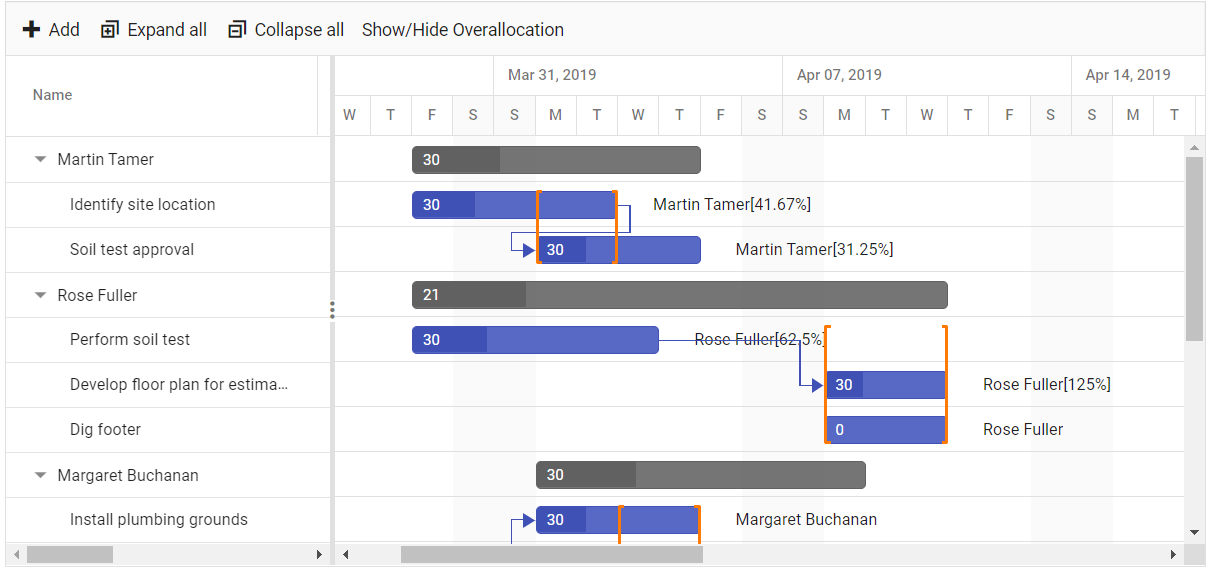
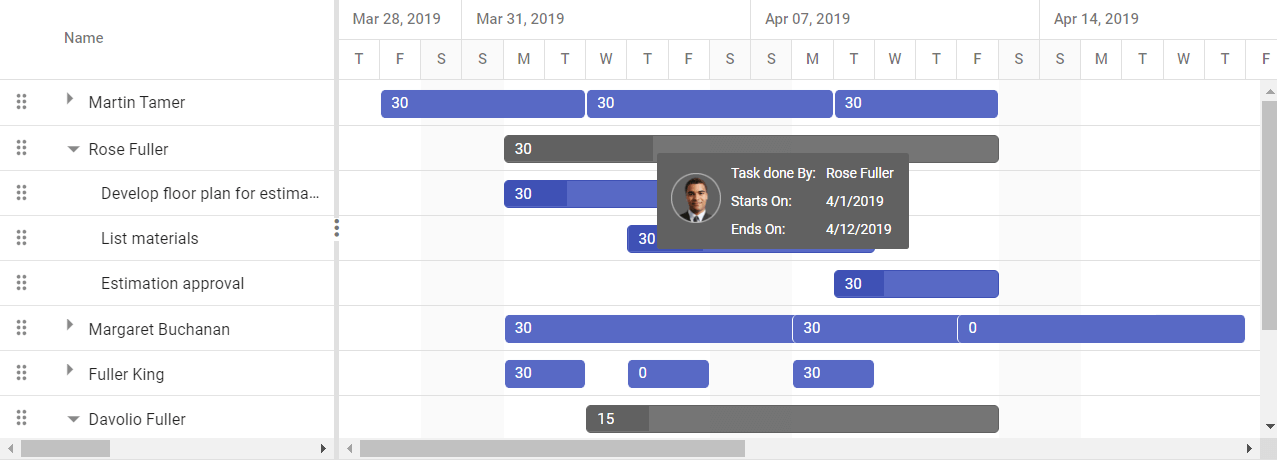
Customization
We have a lot of customization options like displaying the resource picture in the tooltip by using template support, displaying the Gantt Chart with custom color changes in the taskbar, and customizing.
Refer to the following code example.
import * as React from 'react';
import { GanttComponent} from '@syncfusion/ej2-react-gantt';
export default class App extends React.Component {
  constructor() {
    super(...arguments);

    this.templateTaskbar = this.taskbarTooltip;
    this.tooltipSettings = {
      showTooltip: true,
      taskbar: this.templateTaskbar.bind(this)
    };
  taskbarTooltip(props) {
    var src = 'images/' + props.ganttProperties.taskName + '.png';
    return (
    <table>
      {props.hasChildRecords && props.TaskName &&
        <tr>
          <td rowSpan={3} style={{ padding: '3px' }}><img src={src} height='40px' /></td>
          <td style={{ padding: '3px' }}>Task done By:</td>
          <td style={{ padding: '3px' }}>{props.ganttProperties.taskName}</td>
        </tr>}
      <tr>
        <td style={{ padding: '3px' }}>Starts On:</td>
        <td style={{ padding: '3px' }}>{this.ganttInstance.getFormatedDate(props.StartDate)}</td>
      </tr>
      <tr>
        <td style={{ padding: '3px' }}>Ends On:</td>
        <td style={{ padding: '3px' }}>{this.ganttInstance.getFormatedDate(props.EndDate)}</td>
      </tr>
    </table>);
  };

  render() {
    return (
      <GanttComponent  viewType='ResourceView' tooltipSettings={this.tooltipSettings}>
      </GanttComponent>
    );
  }
};
GitHub sample
You can download the complete final sample application from this GitHub repository.
Conclusion
In this article, we have explained why you need a resource view in Gantt Chart for resource management with its benefits. We also provided the steps to getting started with it. To learn more about the resource view in Gantt Chart, refer to this sample browser and documentation. The Syncfusion Gantt Chart resource view is also available for the Blazor, ASP.NET (Core, MVC, Web Forms), UWP, JavaScript, Angular, and Vue platforms.
Resource management is a combination of art and science. So, let’s use Syncfusion Gantt Chart’s resource view to perfectly manage our resources!
If you have any questions, please let us know in the comments section below. You can also contact us through our support forum, Direct-Trac, or feedback portal. We are always happy to assist you!


