A single mind map can better illustrate concepts or ideas than a thousand words. We can easily display various ideas associated with a specific concept.
The Syncfusion Angular Diagram component is a powerful, extensible, and feature-rich library for visualizing, creating, and editing interactive diagrams.
In this blog, we will see how to create a mind map diagram using the Syncfusion Angular Diagram component.
Create a mind map diagram
The Syncfusion Angular Diagram component provides support to visualize mind maps from external data sources. In addition, data in any format can be easily converted, mapped, and consumed in the Diagram by setting a few properties.
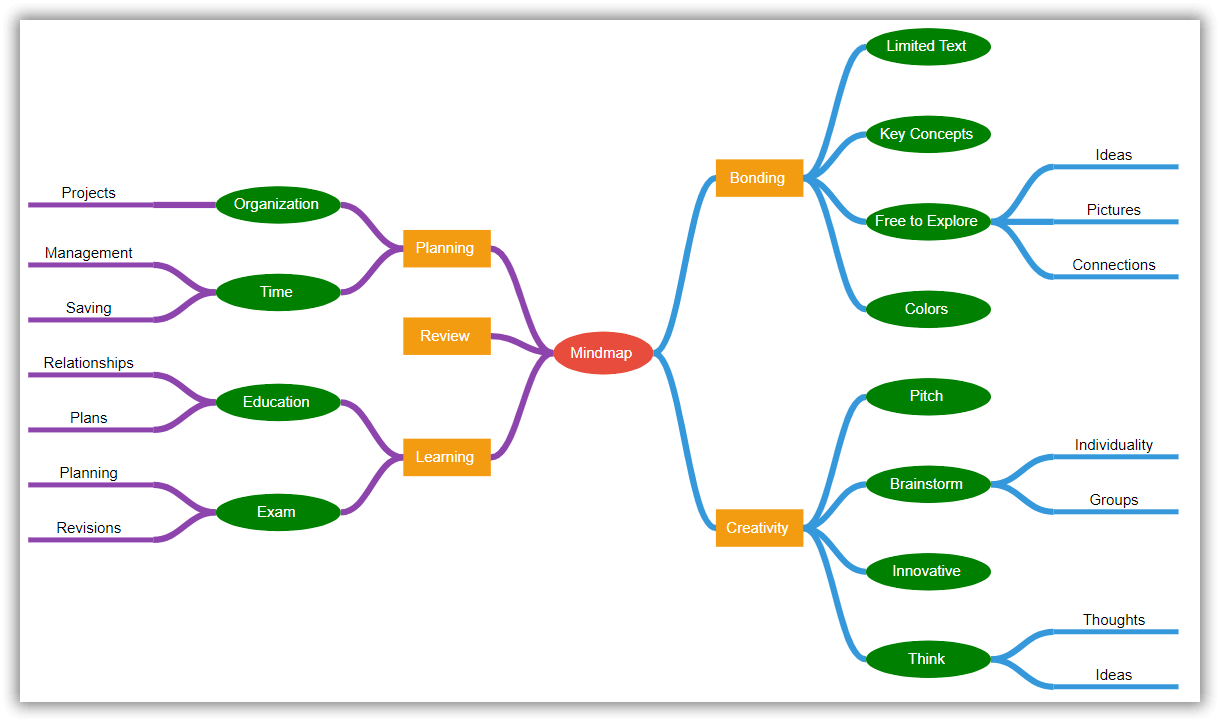
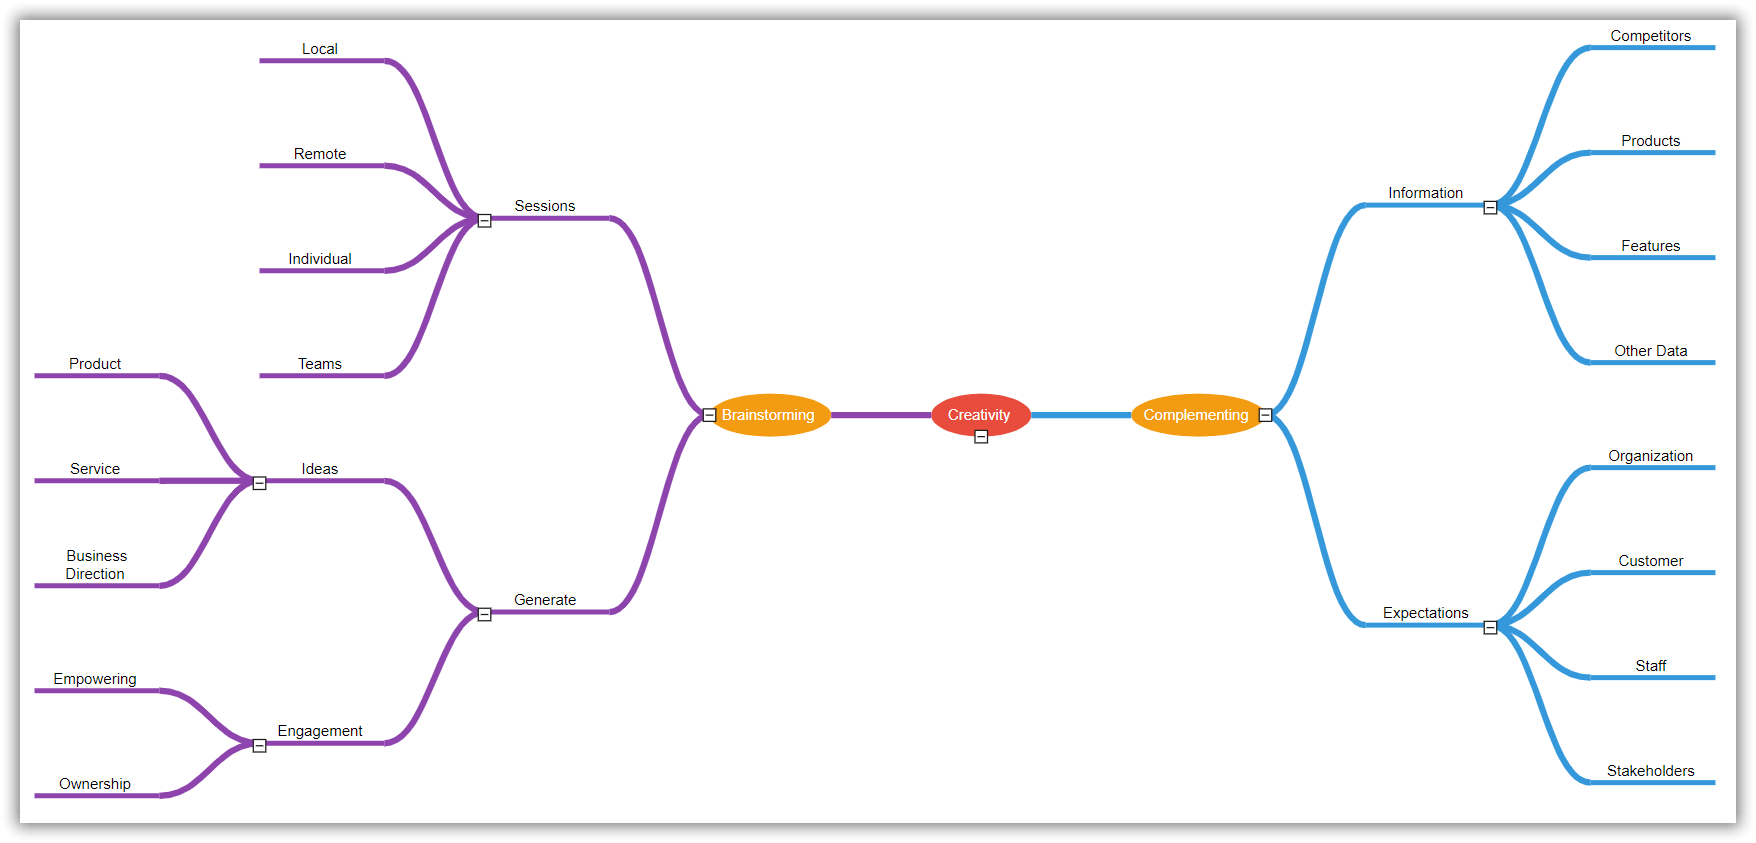
We are going to design the following mind map in this article.
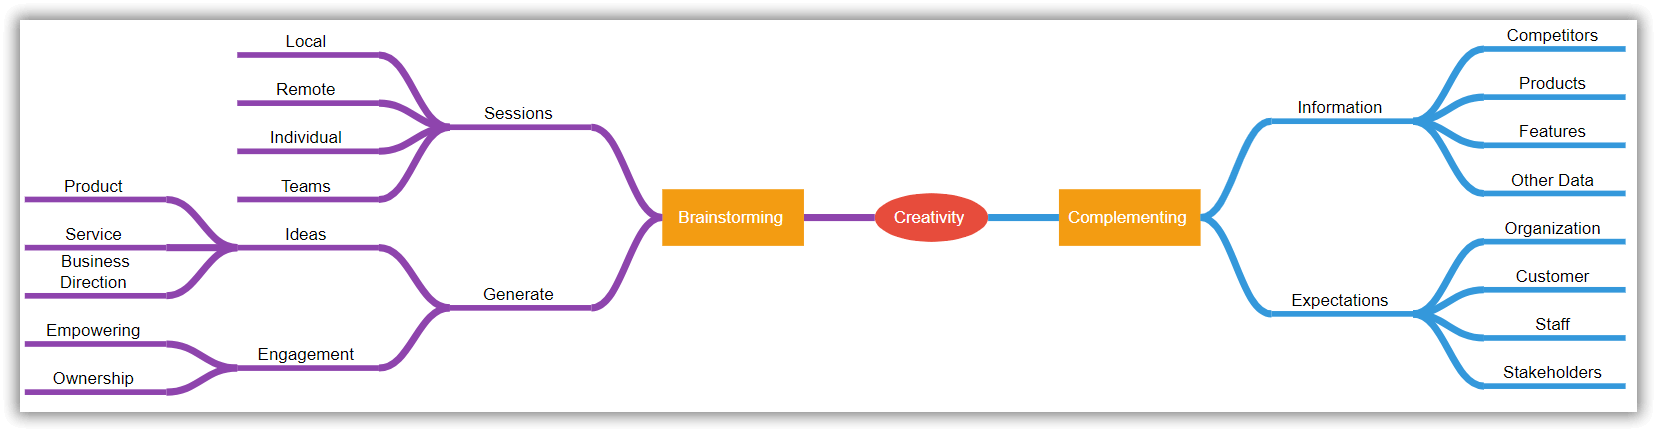
In this image, the ellipse, rectangular boxes, and thick, straight lines with text represent nodes, while the curved lines represent connectors. The text inside the ellipse, rectangular box, and straight lines represent annotations.
Follow these steps to create the mind map diagram using our Angular Diagram component:
- First, refer to the Getting started with Angular Diagram component documentation to see the dependent scripts and theme files required to integrate the component into your Angular application.
- Second, define the tree information as a JSON array.
- Create an instance of the Angular Diagram component.
- Then, configure the data to the dataSourceSettings property of the created Diagram instance.
- Define the common formatting for all nodes and connectors through the getNodeDefaults and getConnectorDefaults methods, respectively.
- After configuring the data source, define the layout type as a mindmap to arrange the nodes’ positions automatically.
The following code example includes all these steps. You can also find the same code on this StackBlitz page.
.html
<div>
    <ejs-diagram #diagram id="diagram" width="100%" height="700px" [getNodeDefaults]=getNodeDefaults [snapSettings]=snapSettings [scrollSettings]="scrollSettings" [selectedItems]="selectedItems" [getCustomTool]='getCustomTool' (selectionChange)="selectionChange($event)" (created)="create($event)" [tool]=tool [layout]='layout' [dataSourceSettings]='data' [getConnectorDefaults]='getConnDefaults'>
    </ejs-diagram>
</div>
.ts
import { Component, ViewEncapsulation, ViewChild } from '@angular/core';
import {
  DiagramComponent,
  Diagram,
  ConnectorModel,
  Connector,
  Node,
  HierarchicalTree,
  DataBinding,
  PointPortModel,
  SnapSettingsModel,
  ScrollSettingsModel,
  PortVisibility,
  MindMap,
  SnapConstraints,
  NodeModel,
  DiagramTools,
  ConnectorConstraints,
  PointPort,
} from '@syncfusion/ej2-angular-diagrams';
import { DataManager } from '@syncfusion/ej2-data';
Diagram.Inject(DataBinding, MindMap, HierarchicalTree);
/**
 * Sample for Mind Map Tree
 */
@Component({
  selector: 'app-root',
  templateUrl: 'app.component.html',
  styleUrls: ['app.component.css'],
  encapsulation: ViewEncapsulation.None,
})
export class AppComponent {
  @ViewChild('diagram') public diagram: DiagramComponent;
  public tool: DiagramTools = DiagramTools.ZoomPan;
  public Data: object[] = [
    { id: 1, Label: 'Creativity', fill: 'red', branch: 'Root' },
    {
      id: 3,
      Label: 'Brainstorming',
      parentId: 1,
      branch: 'Right',
      fill: 'red',
    },
    { id: 4, Label: 'Complementing', parentId: 1, branch: 'Left', fill: 'red' },
    { id: 22, Label: 'Sessions', parentId: 3, branch: 'subRight', fill: 'red' },
    { id: 23, Label: 'Generate', parentId: 3, branch: 'subRight', fill: 'red' },
    { id: 25, Label: 'Local', parentId: 22, branch: 'subRight' },
    { id: 26, Label: 'Remote', parentId: 22, branch: 'subRight' },
    { id: 27, Label: 'Individual', parentId: 22, branch: 'subRight' },
    { id: 28, Label: 'Teams', parentId: 22, branch: 'subRight' },
    { id: 29, Label: 'Ideas', parentId: 23, branch: 'subRight' },
    { id: 30, Label: 'Engagement', parentId: 23, branch: 'subRight' },
    { id: 31, Label: 'Product', parentId: 29, branch: 'subRight' },
    { id: 32, Label: 'Service', parentId: 29, branch: 'subRight' },
    { id: 33, Label: 'Business Direction', parentId: 29, branch: 'subRight' },
    { id: 34, Label: 'Empowering', parentId: 30, branch: 'subRight' },
    { id: 35, Label: 'Ownership', parentId: 30, branch: 'subRight' },
    { id: 50, Label: 'Information', parentId: 4, branch: 'subLeft' },
    { id: 51, Label: 'Expectations', parentId: 4, branch: 'subLeft' },
    { id: 53, Label: 'Competitors', parentId: 50, branch: 'subLeft' },
    { id: 54, Label: 'Products', parentId: 50, branch: 'subLeft' },
    { id: 55, Label: 'Features', parentId: 50, branch: 'subLeft' },
    { id: 56, Label: 'Other Data', parentId: 50, branch: 'subLeft' },
    { id: 59, Label: 'Organization', parentId: 51, branch: 'subLeft' },
    { id: 60, Label: 'Customer', parentId: 51, branch: 'subLeft' },
    { id: 61, Label: 'Staff', parentId: 51, branch: 'subLeft' },
    { id: 62, Label: 'Stakeholders', parentId: 51, branch: 'subLeft' },
  ];
  //Get mind map data.
  public items: DataManager = new DataManager(this.Data);
  public data: Object = {
    id: 'id',
    parentId: 'parentId',
    dataSource: this.items,
    root: '1',
  };
  //Define layout.
  public layout: Object = {
    type: 'MindMap',
    horizontalSpacing: 40,
    getBranch: (node: NodeModel, nodes: NodeModel[]) => {
      return ((node as Node).data as TreeInfo).branch;
    },
  };
  public snapSettings: SnapSettingsModel = {
    constraints: SnapConstraints.None,
  };
  public scrollSettings: ScrollSettingsModel = {
    scrollLimit: 'Infinity',
  };
  public create(args: Object): void {
    this.diagram.fitToPage();
  }
  //Define node default settings.
  public getNodeDefaults: Function = this.nodeDefaults.bind(this);
  //Define connector default settings
  public getConnDefaults: Function = this.getConnectorDefaults.bind(this);
  private nodeDefaults(obj: NodeModel): NodeModel {
    let treeInfo: TreeInfo = obj.data as TreeInfo;
    obj.shape = { type: 'Basic', shape: 'Ellipse' };
    obj.borderColor = 'black';
    obj.style = {
      fill:
        treeInfo.branch === 'Right' || treeInfo.branch === 'subRight'
          ? '#8E44AD'
          : treeInfo.branch === 'Left' || treeInfo.branch === 'subLeft'
          ? '#3498DB'
          : '#E74C3C',
      strokeColor: 'none',
      strokeWidth: 2,
    };
    obj.annotations = [
      {
        content: (obj.data as TreeInfo).Label,
        margin: { left: 10, right: 10, top: 10, bottom: 10 },
        style: { color: 'white' },
      },
    ];
    let port: PointPortModel[] = this.getPort();
    for (let i: number = 0; i < port.length; i++) {
      obj.ports.push(new PointPort(obj, 'ports', port[i], true));
    }
    return obj;
  }
  //sets connector default value.
  private getConnectorDefaults(
    connector: ConnectorModel,
    diagram: Diagram
  ): ConnectorModel {
    connector.type = 'Bezier';
    connector.targetDecorator = { shape: 'None' };
    let sourceNode: Node = diagram.getObject(connector.sourceID) as Node;
    let targetNode: Node = diagram.getObject(connector.targetID) as Node;
    let treeInfo: TreeInfo = targetNode.data as TreeInfo;
    connector.constraints &= ~ConnectorConstraints.Select;
    if (treeInfo.branch === 'Right' || treeInfo.branch === 'subRight') {
      connector.sourcePortID = sourceNode.ports[0].id;
      connector.targetPortID = targetNode.ports[1].id;
    } else if (treeInfo.branch === 'Left' || treeInfo.branch === 'subLeft') {
      connector.sourcePortID = sourceNode.ports[1].id;
      connector.targetPortID = targetNode.ports[0].id;
    }
    return connector;
  }
  private getPort(): PointPortModel[] {
    let port: PointPortModel[] = [
      {
        id: 'port1',
        offset: { x: 0, y: 0.5 },
        visibility: PortVisibility.Hidden,
        style: { fill: 'black' },
      },
      {
        id: 'port2',
        offset: { x: 1, y: 0.5 },
        visibility: PortVisibility.Hidden,
        style: { fill: 'black' },
      },
    ];
    return port;
  }
}
export interface TreeInfo {
  branch: string;
  color: string;
  Left: string;
  Right: string;
  Root: string;
  Label: string;
  Level: string;
}
Interactivity using keyboard and mouse
You can interactively build the mind map diagram using the mouse, touch, and keyboard interfaces. Let’s see how to do so with code examples.
Quick commands
Frequently used commands can be shown as buttons near a selector. You can define the actions as commands for buttons. By doing so, you can perform that action by just clicking the button.
Refer to the following code example and the same on StackBlitz. Here, we have rendered buttons for deleting and left- and right-handling actions.
public handle: UserHandleModel[] = [
    {
      name: 'leftHandle',
      visible: true,
      backgroundColor: 'black',
      offset: 1,
      side: 'Left',
      pathColor: 'white',
      pathData:
        'M11.924,6.202 L4.633,6.202 L4.633,9.266 L0,4.633 L4.632,0 L4.632,3.551 L11.923,3.551 L11.923,6.202Z',
      margin: { top: 0, bottom: 0, left: 0, right: 10 },
      horizontalAlignment: 'Left',
      verticalAlignment: 'Top',
    },
    {
      name: 'delete',
      side: 'Top',
      horizontalAlignment: 'Center',
      verticalAlignment: 'Center',
      pathData:
        'M 7.04 22.13 L 92.95 22.13 L 92.95 88.8 C 92.95 91.92 91.55 94.58 88.76' +
        '96.74 C 85.97 98.91 82.55 100 78.52 100 L 21.48 100 C 17.45 100 14.03 98.91 11.24 96.74 C 8.45 94.58 7.04' +
        '91.92 7.04 88.8 z M 32.22 0 L 67.78 0 L 75.17 5.47 L 100 5.47 L 100 16.67 L 0 16.67 L 0 5.47 L 24.83 5.47 z',
      margin: { top: 0, bottom: 10, left: 0, right: 0 },
      offset: 0.5,
      pathColor: 'white',
    },
    {
      name: 'rightHandle',
      offset: 1,
      horizontalAlignment: 'Right',
      verticalAlignment: 'Top',
      pathColor: 'white',
      pathData:
        'M0,3.063 L7.292,3.063 L7.292,0 L11.924,4.633 L7.292,9.266 L7.292,5.714 L0.001,5.714 L0.001,3.063Z',
      side: 'Right',
      backgroundColor: 'black',
      margin: { top: 0, bottom: 0, left: 10, right: 0 },
    },
  ];
  public selectedItems: SelectorModel = {
    constraints: SelectorConstraints.UserHandle,
    userHandles: this.handle,
  };
Shortcut keys
Using the shortcut keys, you can quickly create mind maps. Based on the specific key gestures, you can specify the actions to be executed.
For example, Tab can be used to add a new topic to the right, Shift+Tab to the left, and Delete to delete the topic and its subtopics.
Refer to the following code example and the same on StackBlitz.
 this.diagram.commandManager = {
      commands: [
        {
          gesture: { key: Keys.Tab },
          canExecute: this.canExecute.bind(this),
          execute: this.addLeftChild.bind(this),
          name: 'leftChild',
        },
        {
          gesture: { key: Keys.Tab, keyModifiers: KeyModifiers.Shift },
          canExecute: this.canExecute.bind(this),
          execute: this.addRightChild.bind(this),
          name: 'rightChild',
        },
        {
          gesture: { key: Keys.Delete },
          canExecute: this.canExecute.bind(this),
          execute: this.removeChild.bind(this),
          name: 'deleteChid',
        },
      ],
    };
private addLeftChild() {
    let selectedObject: any = this.diagram.selectedItems.nodes;
    if (selectedObject[0]) {
      if (selectedObject[0] instanceof Node) {
        let node: NodeModel = addNode();
        let empInfo: EmployeeInfo = selectedObject[0].data as EmployeeInfo;
        if (empInfo.branch === 'Root') {
          (node.data as EmployeeInfo).branch = 'Right';
        } else if (
          empInfo.branch === 'Right' ||
          empInfo.branch === 'subRight'
        ) {
          (node.data as EmployeeInfo).branch = 'subRight';
        } else if (empInfo.branch === 'Left' || empInfo.branch === 'subLeft') {
          (node.data as EmployeeInfo).branch = 'subLeft';
        }
        let connector: ConnectorModel = addConnector(selectedObject[0], node);
        this.diagram.clearSelection();
        let nd: Node = this.diagram.add(node) as Node;
        this.diagram.add(connector);
        this.diagram.doLayout();
        this.diagram.startTextEdit(nd);
      }
    }
  }
  private addRightChild() {
    let selectedObject: any = this.diagram.selectedItems.nodes;
    if (selectedObject[0]) {
      if (selectedObject[0] instanceof Node) {
        let node: NodeModel = addNode();
        let empInfo: EmployeeInfo = selectedObject[0].data as EmployeeInfo;
        if (empInfo.branch === 'Root') {
          (node.data as EmployeeInfo).branch = 'Left';
        } else if (empInfo.branch === 'Left' || empInfo.branch === 'subLeft') {
          (node.data as EmployeeInfo).branch = 'subLeft';
        } else if (
          empInfo.branch === 'Right' ||
          empInfo.branch === 'subRight'
        ) {
          (node.data as EmployeeInfo).branch = 'subRight';
        }
        let connector: ConnectorModel = addConnector(selectedObject[0], node);
        this.diagram.clearSelection();
        let nd: Node = this.diagram.add(node) as Node;
        this.diagram.add(connector);
        this.diagram.doLayout();
        this.diagram.startTextEdit(nd);
      }
    }
  }
  private removeChild() {
    let selectedObject: any = this.diagram.selectedItems.nodes;
    if (selectedObject[0]) {
      if (selectedObject[0] instanceof Node) {
        let node: Node = selectedObject[0] as Node;
        this.removeSubChild(node);
      }
      this.diagram.doLayout();
    }
  }
  //Remove the subchild Elements
  private removeSubChild(node: Node): void {
    for (let i: number = node.outEdges.length - 1; i >= 0; i--) {
      let connector: Connector = this.diagram.getObject(
        node.outEdges[i]
      ) as Connector;
      let childNode: Node = this.diagram.getObject(connector.targetID) as Node;
      if (childNode.outEdges.length > 0) {
        this.removeSubChild(childNode);
      } else {
        this.diagram.remove(childNode);
      }
    }
    this.diagram.remove(node);
  }
Expand and collapse children nodes
Use the expandIcon and collapseIcon properties of nodes to implement the expand and collapse features in the mind map’s children nodes.
Refer to the following example and the same on StackBlitz.
private getNodeDefaults(obj: NodeModel): NodeModel {
    ........
        obj.expandIcon = {
          shape: 'Minus',
        };
        obj.collapseIcon = {
          shape: 'Plus',
        };
    ........
    return obj;
  }
Drag and drop
You can easily change the mind map layout by dragging a topic or subtopic and dropping it on the required location.
Add the following code to the Diagram control’s drop method to enable editing in the mind map’s tree structure. Also, the same code is available on StackBlitz.
public drop(args): void {
    if (args.target && args.target instanceof Node) {
      let connector: ConnectorModel = this.diagram.getObject(
        args.element.inEdges[0]
      );
      connector.sourceID = args.target.id;
      this.diagram.dataBind();
      this.diagram.doLayout();
      //Update connector connection direction.
      let srcNode: NodeModel = args.element;
      let targetNode: NodeModel = args.target;
      let srctreeInfo: TreeInfo = srcNode.data as TreeInfo;
      let targettreeInfo: TreeInfo = targetNode.data as TreeInfo;
      if (
        (srctreeInfo.branch === 'Right' || srctreeInfo.branch === 'subRight') &&
        (targettreeInfo.branch === 'Left' ||
          targettreeInfo.branch === 'subLeft')
      ) {
        connector.sourcePortID = targetNode.ports[1].id;
        connector.targetPortID = srcNode.ports[0].id;
        this.updateRightTopicOutEdges(srcNode);
      } else if (
        (srctreeInfo.branch === 'Left' || srctreeInfo.branch === 'subLeft') &&
        (targettreeInfo.branch === 'Right' ||
          targettreeInfo.branch === 'subRight')
      ) {
        connector.sourcePortID = targetNode.ports[0].id;
        connector.targetPortID = srcNode.ports[1].id;
        this.updateLeftTopicOutEdges(srcNode);
      }
      // update your local data source when modifying mind map topics.
      this.updateDataSource(args.element, args.target);
    }
  }
  private updateRightTopicOutEdges(node: NodeModel) {
    for (var i = 0; i < (node as Node).outEdges.length; i++) {
      let outconnector: ConnectorModel = this.diagram.getObject(
        (node as Node).outEdges[i]
      );
      outconnector.sourcePortID = 'port2';
      outconnector.targetPortID = 'port1';
      let targetNode: NodeModel = this.diagram.getObject(outconnector.targetID);
      if ((targetNode as Node).outEdges) {
        this.updateRightTopicOutEdges(targetNode);
      }
    }
  }
  private updateLeftTopicOutEdges(node: NodeModel) {
    for (var i = 0; i < (node as Node).outEdges.length; i++) {
      let outconnector: ConnectorModel = this.diagram.getObject(
        (node as Node).outEdges[i]
      );
      outconnector.sourcePortID = 'port1';
      outconnector.targetPortID = 'port2';
      let targetNode: NodeModel = this.diagram.getObject(outconnector.targetID);
      if ((targetNode as Node).outEdges) {
        this.updateLeftTopicOutEdges(targetNode);
      }
    }
  }
  private updateDataSource(source, target): void {
    let updateData = this.Data.find(function (element) {
      return element.id === source.data.id;
    });
    if (updateData) {
      updateData.parentId = target.data.id;
    }
  }
Mind map shape customization
You can easily customize the appearance of each level of nodes by adding backgrounds, border styles, text styles, and images and visualize them with a custom UI design.
The getNodeDefaults method lets you specify a custom shape and style for each node based on its level value.
Refer to the following code example and the same on StackBlitz.
private getNodeDefaults(obj: NodeModel): NodeModel {
    obj.constraints = NodeConstraints.Default & ~NodeConstraints.Drag;
    let empInfo: TreeInfo = obj.data as TreeInfo;
    if (
      empInfo.branch === 'Root' ||
      empInfo.branch === 'Left' ||
      empInfo.branch === 'Right'
    ) {
      obj.shape = {
        type: 'Basic',
        shape: empInfo.branch === 'Root' ? 'Ellipse' : 'Rectangle',
      };
      obj.borderColor = 'black';
      obj.style = {
        fill: empInfo.branch === 'Root' ? '#E74C3C' : '#F39C12',
        strokeColor: 'none',
        strokeWidth: 2,
      };
      obj.annotations = [
        {
          content: empInfo.Label,
          margin: { left: 10, right: 10, top: 10, bottom: 10 },
          style: { color: 'white' },
        },
      ];
      if (empInfo.branch === 'Left' || empInfo.branch === 'Right') {
        obj.height = 40;
        obj.width = 100;
      }
    } else {
      let color: string =
        empInfo.branch === 'subRight'
          ? empInfo.Level === '2'
            ? 'Green'
            : '#8E44AD'
          : empInfo.Level === '2'
          ? 'Green'
          : '#3498DB';
      obj.shape = {
        type: 'Basic',
        shape: empInfo.Level === '2' ? 'Ellipse' : 'Rectangle',
      };
      obj.style = { fill: color, strokeWidth: 0 };
      obj.minWidth = 100;
      obj.height = empInfo.Level === '2' ? 30 : 4;
      obj.annotations = [
        {
          content: empInfo.Label,
          offset: empInfo.Level === '2' ? { x: 0.5, y: 0.5 } : { x: 0.5, y: 0 },
          verticalAlignment: empInfo.Level === '2' ? 'Center' : 'Bottom',
          style: { color: empInfo.Level === '2' ? 'white' : 'black' },
        },
      ];
      (obj.shape as TextModel).margin = {
        left: 0,
        right: 0,
        top: 0,
        bottom: 0,
      };
    }
    let port: PointPortModel[] = this.getPort();
    for (let i: number = 0; i < port.length; i++) {
      (obj as any).ports.push(new PointPort(obj, 'ports', port[i], true));
    }
    return obj;
  }
  //sets connector default value
  private getConnectorDefaults(
    connector: ConnectorModel | any,
    diagram: Diagram
  ): ConnectorModel {
    let sourceNode: Node = diagram.getObject(connector.sourceID) as Node;
    let targetNode: Node = diagram.getObject(connector.targetID) as Node;
    let empInfo: TreeInfo = targetNode.data as TreeInfo;
    connector.type = 'Bezier';
    connector.targetDecorator = { shape: 'None' };
    connector.constraints &= ~ConnectorConstraints.Select;
    if (empInfo.branch === 'Right' || empInfo.branch === 'subRight') {
      connector.sourcePortID = sourceNode.ports[0].id;
      connector.targetPortID = targetNode.ports[1].id;
      connector.style = { strokeWidth: 5, strokeColor: '#8E44AD' };
    } else if (empInfo.branch === 'Left' || empInfo.branch === 'subLeft') {
      connector.sourcePortID = sourceNode.ports[1].id;
      connector.targetPortID = targetNode.ports[0].id;
      connector.style = { strokeWidth: 5, strokeColor: '#3498DB' };
    }
    return connector;
  }
  private getPort(): PointPortModel[] {
    let port: PointPortModel[] = [
      {
        id: 'port1',
        offset: { x: 0, y: 0.5 },
        visibility: PortVisibility.Hidden,
        style: { fill: 'black' },
      },
      {
        id: 'port2',
        offset: { x: 1, y: 0.5 },
        visibility: PortVisibility.Hidden,
        style: { fill: 'black' },
      },
    ];
    return port;
  }
Spacing
Adjust the spacing between each level of the mind map diagram horizontally and vertically. You can also define a margin around the mind map diagram, like in the following code example.
public layout: Object = {
    type: 'MindMap',
    horizontalSpacing: 80,
    verticalSpacing: 80,
    getBranch: (node: NodeModel, nodes: NodeModel[]) => {
      return ((node as Node).data as TreeInfo).branch;
    },
  };
Zooming and panning
Viewing a large mind map on a small screen can be challenging. In that case, zooming and panning help us provide a more detailed view of the mind map.
You can zoom in and out of the diagram using the Ctrl + mouse wheel shortcut key.
Refer to the following code examples and the same on StackBlitz to enable zooming and panning support in the mind map diagram.
.html
<div class="col-lg-8 control-section" style="width: 100%;">
  <div class="content-wrapper">
    <ejs-diagram
      #diagram
      id="diagram"
      width="100%"
      height="700px"
      [getNodeDefaults]="getShapeDefaults"
      [snapSettings]="snapSettings"
      [scrollSettings]="scrollSettings"
      [tool]="tool"
      [layout]="layout"
      [dataSourceSettings]="data"
      [getConnectorDefaults]="getConnDefaults"
    >
    </ejs-diagram>
  </div>
</div>
.ts
//Enable pan tool.
  public tool: DiagramTools = DiagramTools.ZoomPan;
Exporting
You can easily export the mind map diagram to different image formats such as PNG, JPEG, BMP, and SVG.
Refer to the following code example and the same on StackBlitz to explore this feature.
let exportOptions: IExportOptions = {};
    exportOptions.format = args.item.text as FileFormats;
    exportOptions.mode = 'Download';
    exportOptions.region = 'Content';
    exportOptions.multiplePage = false;
    exportOptions.fileName = 'Mindmap';
    this.diagram.exportDiagram(exportOptions);

Conclusion
Thanks for reading! In this blog post, we have seen how to create and customize a mind map using the Syncfusion Angular Diagram component. With the same component, you can also create flowcharts, organizational charts, floor plans, UML diagrams, and BPMN charts. Try out the steps in this blog and provide your feedback in the comments section!
If you would like to try out the Diagram, You can download our free trial. You can also look at the Diagram source on GitHub and check our live demo and documentation for detailed explanations.
Contact us through our support forum, support portal, or Feedback Portal. We are always happy to assist you!