---
title: "Build a High-Performance Financial Dashboard in Blazor with Syncfusion Components"
published_at: "2025-11-11T13:27:37+00:00"
modified_at: "2025-11-12T05:16:20+00:00"
url: "https://www.syncfusion.com/blogs/post/financial-dashboard-in-blazor"
excerpt: "Build a responsive financial dashboard in Blazor with DataGrid, Pivot Table, and Charts. Includes performance tips and source code."
taxonomy_category:
- "Blazor"
- "Blazor DataGrid"
- "C#"
- "Data Visualization"
- "Pivot Table"
taxonomy_post_tag:
- "Blazor"
- "Charts"
- "Data Visualization"
- "Performance optimization"
- "Pivot Table"
- "Syncfusion"
---
# Build a High-Performance Financial Dashboard in Blazor with Syncfusion Components
[Manikandan Murugesan](https://www.syncfusion.com/blogs/author/manikandan-murugesan)
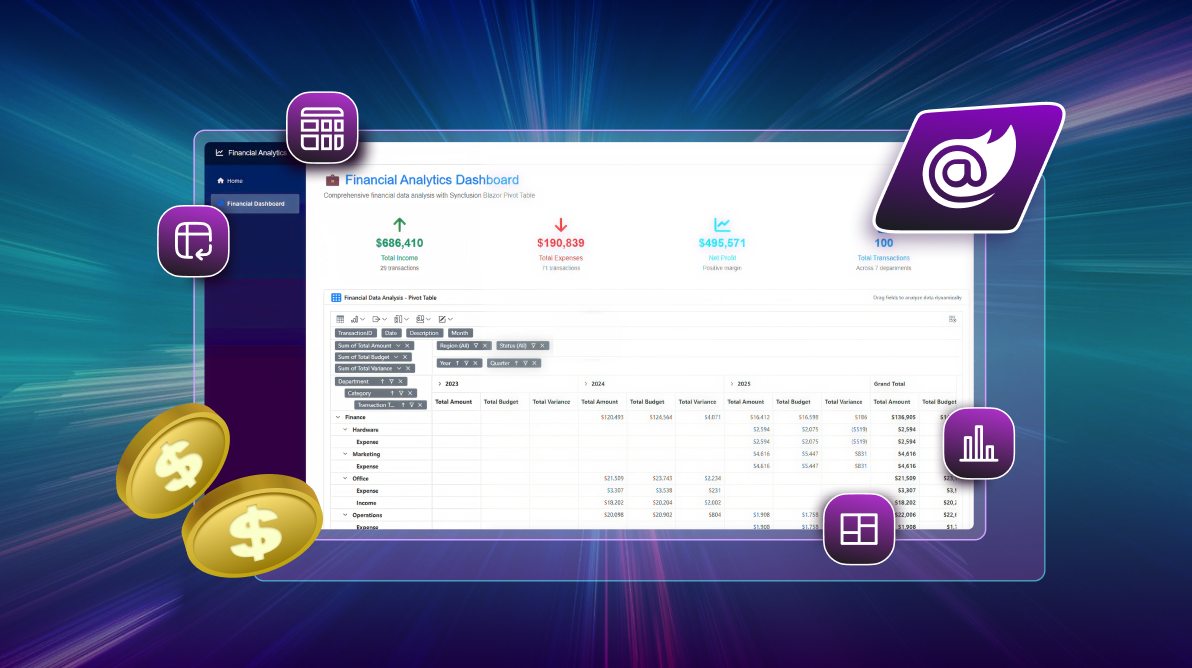
**TL;DR:** Learn how to build a high-performance financial dashboard in Blazor using Syncfusion components. This guide covers responsive layout design, interactive charts, pivot tables for financial analysis, and proven techniques to optimize dashboard performance.
Managing financial data doesn’t have to be overwhelming. Imagine having a sleek dashboard that turns raw numbers into actionable insights, right inside your browser.
That’s where [Blazor](https://www.syncfusion.com/blazor-components)
comes in. With its powerful C# based framework for building interactive client-side web UIs, it provides a solid foundation for creating rich data experiences. When combined with Syncfusion’s high-performance Blazor components, you can build enterprise-grade financial dashboards that are both powerful and intuitive.
This blog post will guide you through building a financial dashboard using Syncfusion’s Blazor [Pivot Table](https://www.syncfusion.com/blazor-components/blazor-pivot-table)
, [DataGrid](https://www.syncfusion.com/blazor-components/blazor-datagrid)
, [Chart](https://www.syncfusion.com/blazor-components/blazor-charts)
, and [DashboardLayout](https://www.syncfusion.com/blazor-components/blazor-dashboard)
components. We’ll focus on best practices, performance optimization, and creating a visually compelling and interactive user experience.
## Prerequisites
Before getting started, make sure the following components are set up:
- [.NET 9 SDK](https://dotnet.microsoft.com/download/dotnet/9.0) **:** Ensure it’s installed and properly configured.
- **Code Editor:** Use either [Visual Studio Code](https://code.visualstudio.com/) or **Visual Studio 2022** for development.
- **Syncfusion Blazor Packages:** Install the necessary packages and activate them using a valid license key. If you don’t have one, you can sign up for a [free 30-day trial](https://www.syncfusion.com/downloads/blazor) to get started.
## Step 1: Create a Blazor project
To begin, we’ll create a new Blazor Server application using Visual Studio Code. This sets the foundation for our financial dashboard.
```
dotnet new blazorserver -n BlazorFinancialDashboard
cd BlazorFinancialDashboard
```
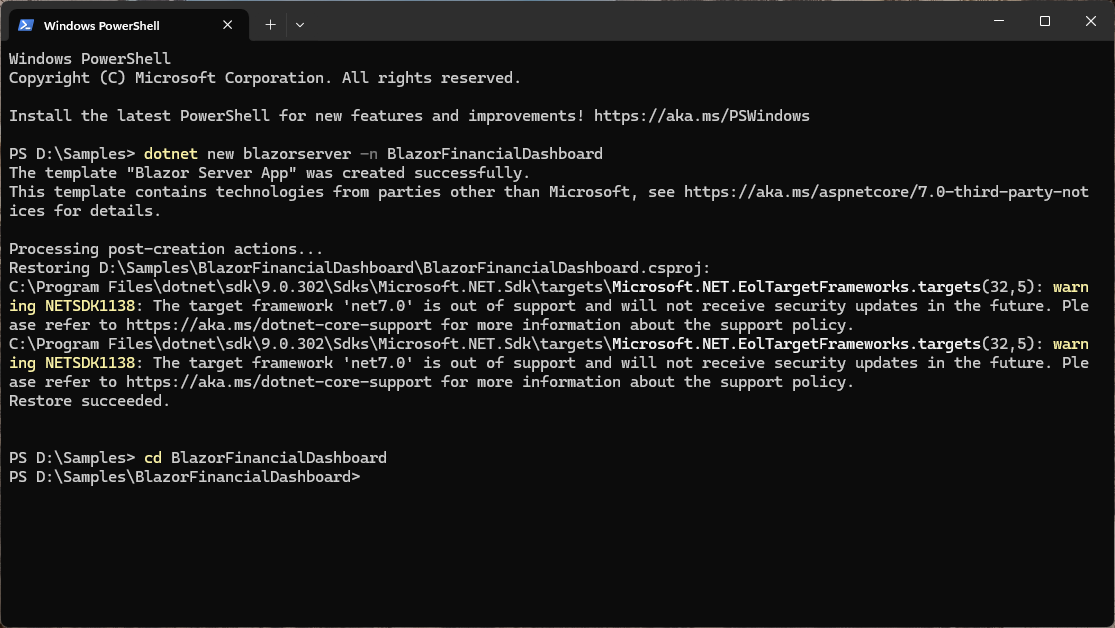
Creating a Blazor Server application
## Step 2: Integrating Syncfusion components
Next, we’ll add the necessary Syncfusion Blazor packages for Grid, Pivot Table, Charts, Layouts, and Themes:
```
dotnet add package Syncfusion.Blazor.Grid
dotnet add package Syncfusion.Blazor.PivotTable
dotnet add package Syncfusion.Blazor.Charts
dotnet add package Syncfusion.Blazor.Layouts
dotnet add package Syncfusion.Blazor.Themes
```
Then, register the Syncfusion services in the **Program.cs**.
```
// Program.cs
using Syncfusion.Blazor;
var builder = WebApplication.CreateBuilder(args);
// Add services to the container.
…
builder.Services.AddSyncfusionBlazor(); // Register Syncfusion services
var app = builder.Build();
// ...
```
Next, add the Syncfusion theme and script references in `_Host.cshtml`. Since this demo uses only **PivotTable, DataGrid, Chart,** and**DashboardLayout**, include their specific scripts to optimize performance and reduce load time, as shown in the example below.
```
// Pages/_Host.cshtml
…
…
```
Finally, add the Syncfusion Blazor namespaces to **_Imports.razor** to make the components available throughout the application.
```
// _Imports.razor
@using Syncfusion.Blazor
@using Syncfusion.Blazor.Grids
@using Syncfusion.Blazor.PivotView
@using Syncfusion.Blazor.Charts
@using Syncfusion.Blazor.Layouts
```
## Step 3: Build the dashboard layout
A well-structured dashboard is key to delivering an excellent user experience. The SfDashboardLayout component offers a flexible, grid-based layout that allows users to easily rearrange and resize panels.
To implement this, create a new Razor component named **FinancialDashboard.razor** in the Pages folder. In this layout, we’ll define three panels: one for the ** DataGrid**, one for the ** Pivot Table**, and one for the ** Chart**.
```
@page "/financial-dashboard"
Transaction Details
@* DataGrid will go here *@
Financial Analysis
@* Pivot Table will go here *@
Income vs. Expense
@* Chart will go here *@
```
## Step 4: Display detailed data with DataGrid
The **SfGrid** component is perfect for displaying and managing tabular data. In this dashboard, we’ll use it to present a list of financial transactions in a clean, interactive format.
First, create a **model** to represent your financial data.
```
// Models/FinancialData.cs
public class FinancialData
{
public int TransactionID { get; set; }
public DateTime Date { get; set; }
public string Description { get; set; }
public string Category { get; set; }
public decimal Amount { get; set; }
public string Type { get; set; } // "Income" or "Expense"
}
```
Then, add the SfGrid to our **FinancialDashboard.razor** component to bind and display the data.
```
// Inside the gridPanel ContentTemplate in FinancialDashboard.razor
@code {
private List transactions = new();
protected override void OnInitialized()
{
// Populate with sample data
transactions = GetFinancialData();
}
private List GetFinancialData()
{
// ... implementation to get data
return new List(); // return sample data
}
}
```
## Step 5: Analyze data with Pivot Table
The SfPivotView component is the centerpiece of our financial dashboard, enabling powerful multi-dimensional analysis.
Add SfPivotView to the FinancialDashboard.razor component and configure it to display total amounts by category and type, with drill-down capability by year. This setup gives users a clear, interactive view of financial trends.
```
// Inside the pivotPanel ContentTemplate in FinancialDashboard.razor
@code {
// ... existing code ...
public class FinancialData
{
// ... properties
public string Year => Date.Year.ToString();
}
}
```
## Step 6: Visualize trends with charts
The **SfChart** component makes it easy to turn raw data into meaningful visuals. For this dashboard, we’ll create a ** Column Chart** to compare ** income vs expenses,**providing users with a quick snapshot of financial trends.
```
// Inside the chartPanel ContentTemplate in FinancialDashboard.razor
@code {
// ... existing code ...
private List chartData = new();
protected override void OnInitialized()
{
transactions = GetFinancialData();
chartData = transactions
.GroupBy(t => t.Category)
.Select(g => new ChartData { Category = g.Key, Amount = g.Sum(t => t.Amount) })
.ToList();
}
public class ChartData
{
public string Category { get; set; }
public decimal Amount { get; set; }
}
}
```
## Step 7: Optimize performance
Handling large datasets efficiently is critical for a smooth user experience. Syncfusion Blazor components are built with performance in mind, and here are some best practices to make your dashboard lightning-fast:
- **Virtualization:** Both ** SfGrid** and ** SfPivotView** support virtualization to render large datasets without slowing down the UI. Enable it by setting ** EnableVirtualization** to true.
- **On-demand loading:** For the Pivot Table, you can set ** AllowDeferLayoutUpdate** to true. This prevents unnecessary re-rendering during UI interactions.
- **Server-side data processing:** For massive datasets, you can process data on the server and send only the aggregated data to the client. This reduces payload size and improves responsiveness.
The output of the application will appear as shown in the following GIF.
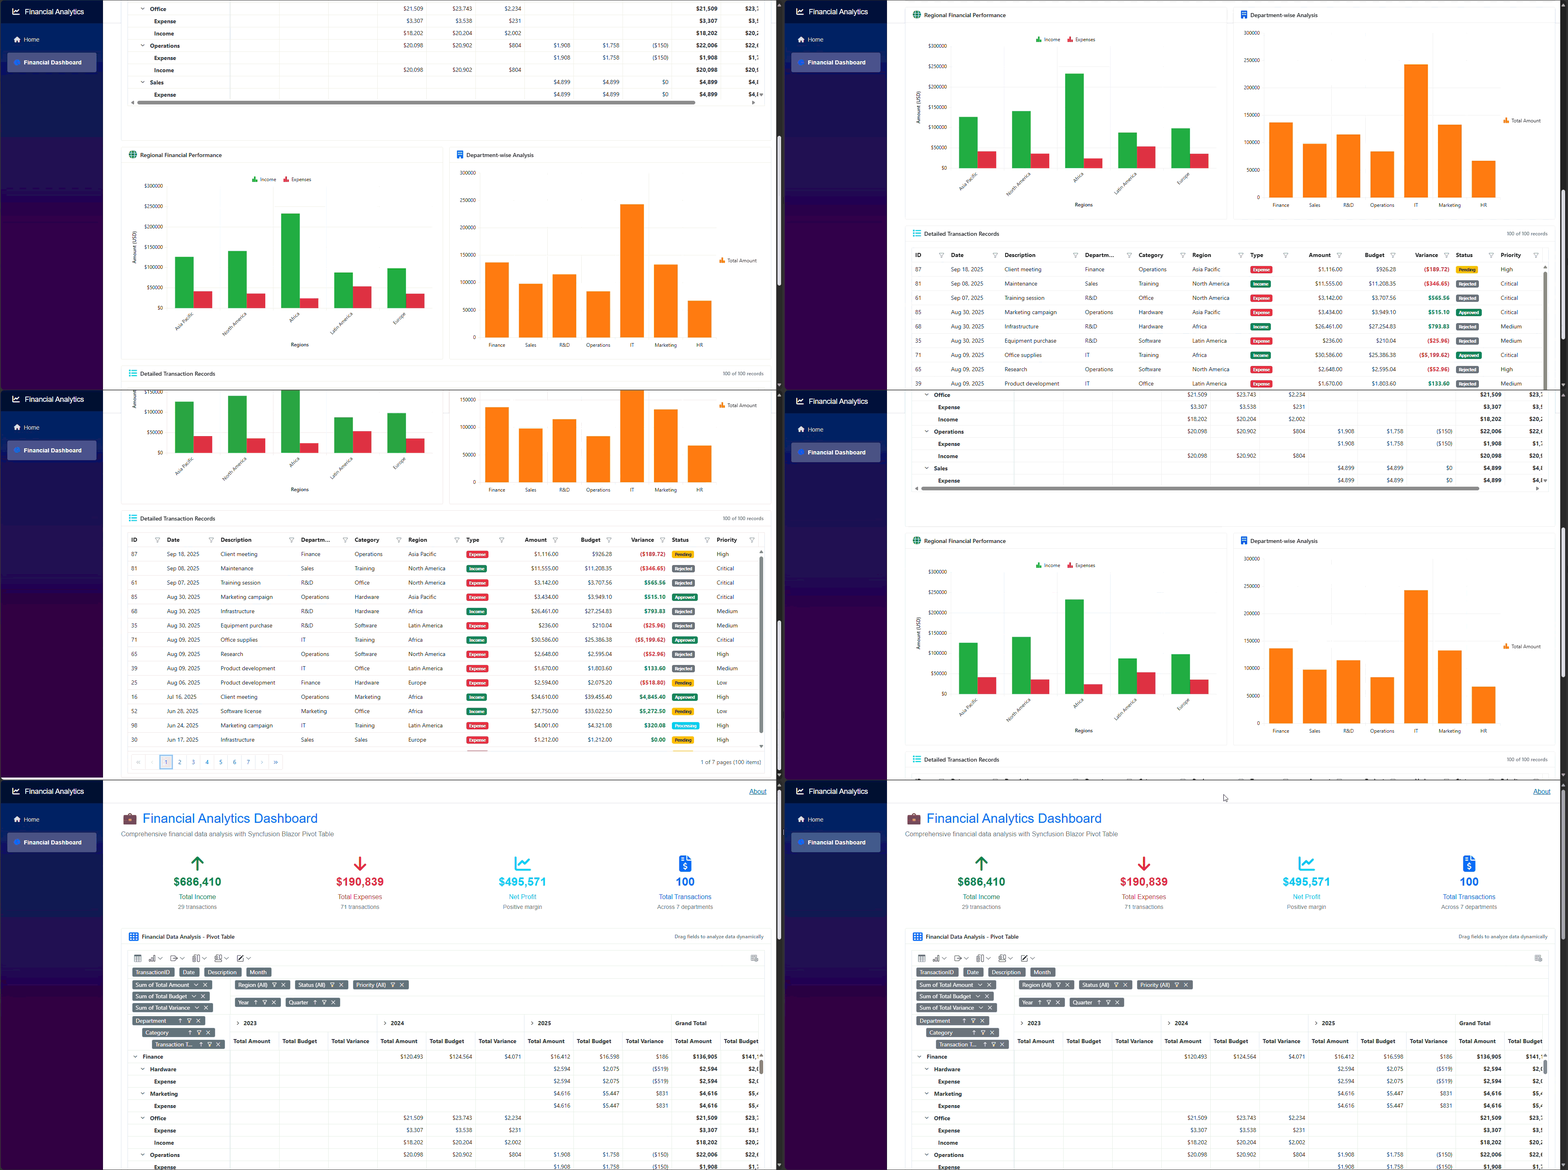
Visualize a financial dashboard in Blazor built with Syncfusion components
## GitHub reference
For more details, you can view the complete source code for this example on [GitHub](https://github.com/SyncfusionExamples/blazor-financial-dashboard-syncfusion)
.
## Conclusion
Thank you for reading! In this guide, we demonstrated how to build a financial dashboard using Syncfusion [Blazor](https://www.syncfusion.com/blazor-components)
components. We utilized **SfDashboardLayout** to create flexible layouts, displayed transaction data with ** SfGrid**, performed multi-dimensional analysis using ** SfPivotView**, and visualized trends through ** SfChart**.
By combining Blazor’s flexibility with Syncfusion’s high-performance components, you can create dashboards that deliver real-time insights and an exceptional user experience. To learn more about Syncfusion Blazor components, check out the [official documentation](https://blazor.syncfusion.com/documentation/introduction)
.
If you’re a Syncfusion user, you can download the setup from the [license and downloads](https://www.syncfusion.com/account/downloads)
page. Otherwise, you can download a free [30-day trial](https://www.syncfusion.com/downloads/)
.
You can also contact us through our [support forum](https://www.syncfusion.com/forums)
, [support portal](https://support.syncfusion.com/)
, or [feedback portal](https://www.syncfusion.com/feedback/angular)
for queries. We are always happy to assist you!
## Related Blogs
[Build Real-Time Dashboards in Blazor with gRPC Streaming for High-Performance Apps](https://www.syncfusion.com/blogs/post/blazor-with-grpc-streaming)
[Build an AI Powered Air Quality Dashboard Using Blazor Spline Chart and GPT-4o](https://www.syncfusion.com/blogs/post/blazor-spline-chart-dashboard)
[Visualize Financial Insights Instantly with Blazor Waterfall Charts](https://www.syncfusion.com/blogs/post/blazor-waterfall-charts-financial-insights)
[Forecast the Future: AI-Powered Predictions in Blazor Pivot Table](https://www.syncfusion.com/blogs/post/blazor-ai-forecasting-blazor-pivot-table)