---
title: "Elegantly Visualize Data with Interactive Features in .NET MAUI Charts"
published_at: "2023-03-27T11:16:27+00:00"
modified_at: "2026-06-24T10:46:57+00:00"
url: "https://www.syncfusion.com/blogs/post/elegantly-visualize-data-with-interactive-features-in-net-maui-charts"
excerpt: "Syncfusion’s .NET MAUI Charts control provides various interactive features such as tooltips, trackball, selection, and more to interact with data in an excellent user experience."
taxonomy_category:
- ".NET MAUI"
- "Chart"
- "Desktop"
- "Mobile"
- "UI"
taxonomy_post_tag:
- ".NET MAUI"
- "Charts"
- "desktop"
- "MAUI"
- "Mobile"
---
# Elegantly Visualize Data with Interactive Features in .NET MAUI Charts
[Saravanan Madheswaran](https://www.syncfusion.com/blogs/author/saravanan-madheswaran)

Charts are the perfect tools for visualizing a huge volume of data in a limited space. They help us easily understand trends in data through appealing visual representations.
[Syncfusion .NET MAUI Charts](https://www.syncfusion.com/maui-controls/maui-cartesian-charts)
is a well-crafted charting control for visualizing data. It provides a rich gallery of more than 10 chart and graph types that cater to all charting scenarios. One of its most powerful features is its interactive capabilities.
In this blog, we’ll look at some of the rich interactive features of the .NET MAUI Charts with code examples.
Build Interactive .NET MAUI Charts Faster
Create visually rich charts with Syncfusion .NET MAUI Charts. Easily visualize data using line, column, bar, area, pie, and financial charts with built-in support for tooltips, legends, zooming, selection, and customization.
[Explore .NET MAUI Charts](https://www.syncfusion.com/maui-controls/maui-cartesian-charts)
## Tooltips
[Tooltips](https://help.syncfusion.com/maui/cartesian-charts/tooltip)
are small windows that appear when a user hovers over a specific data point on the chart. They can display additional information about the data point, such as its value and category. Tooltips can be opened by tapping a data point on mobile devices or moving the pointer over a data point on desktop devices.
The following code example shows how to enable tooltips in a chart.
```
. . .
```
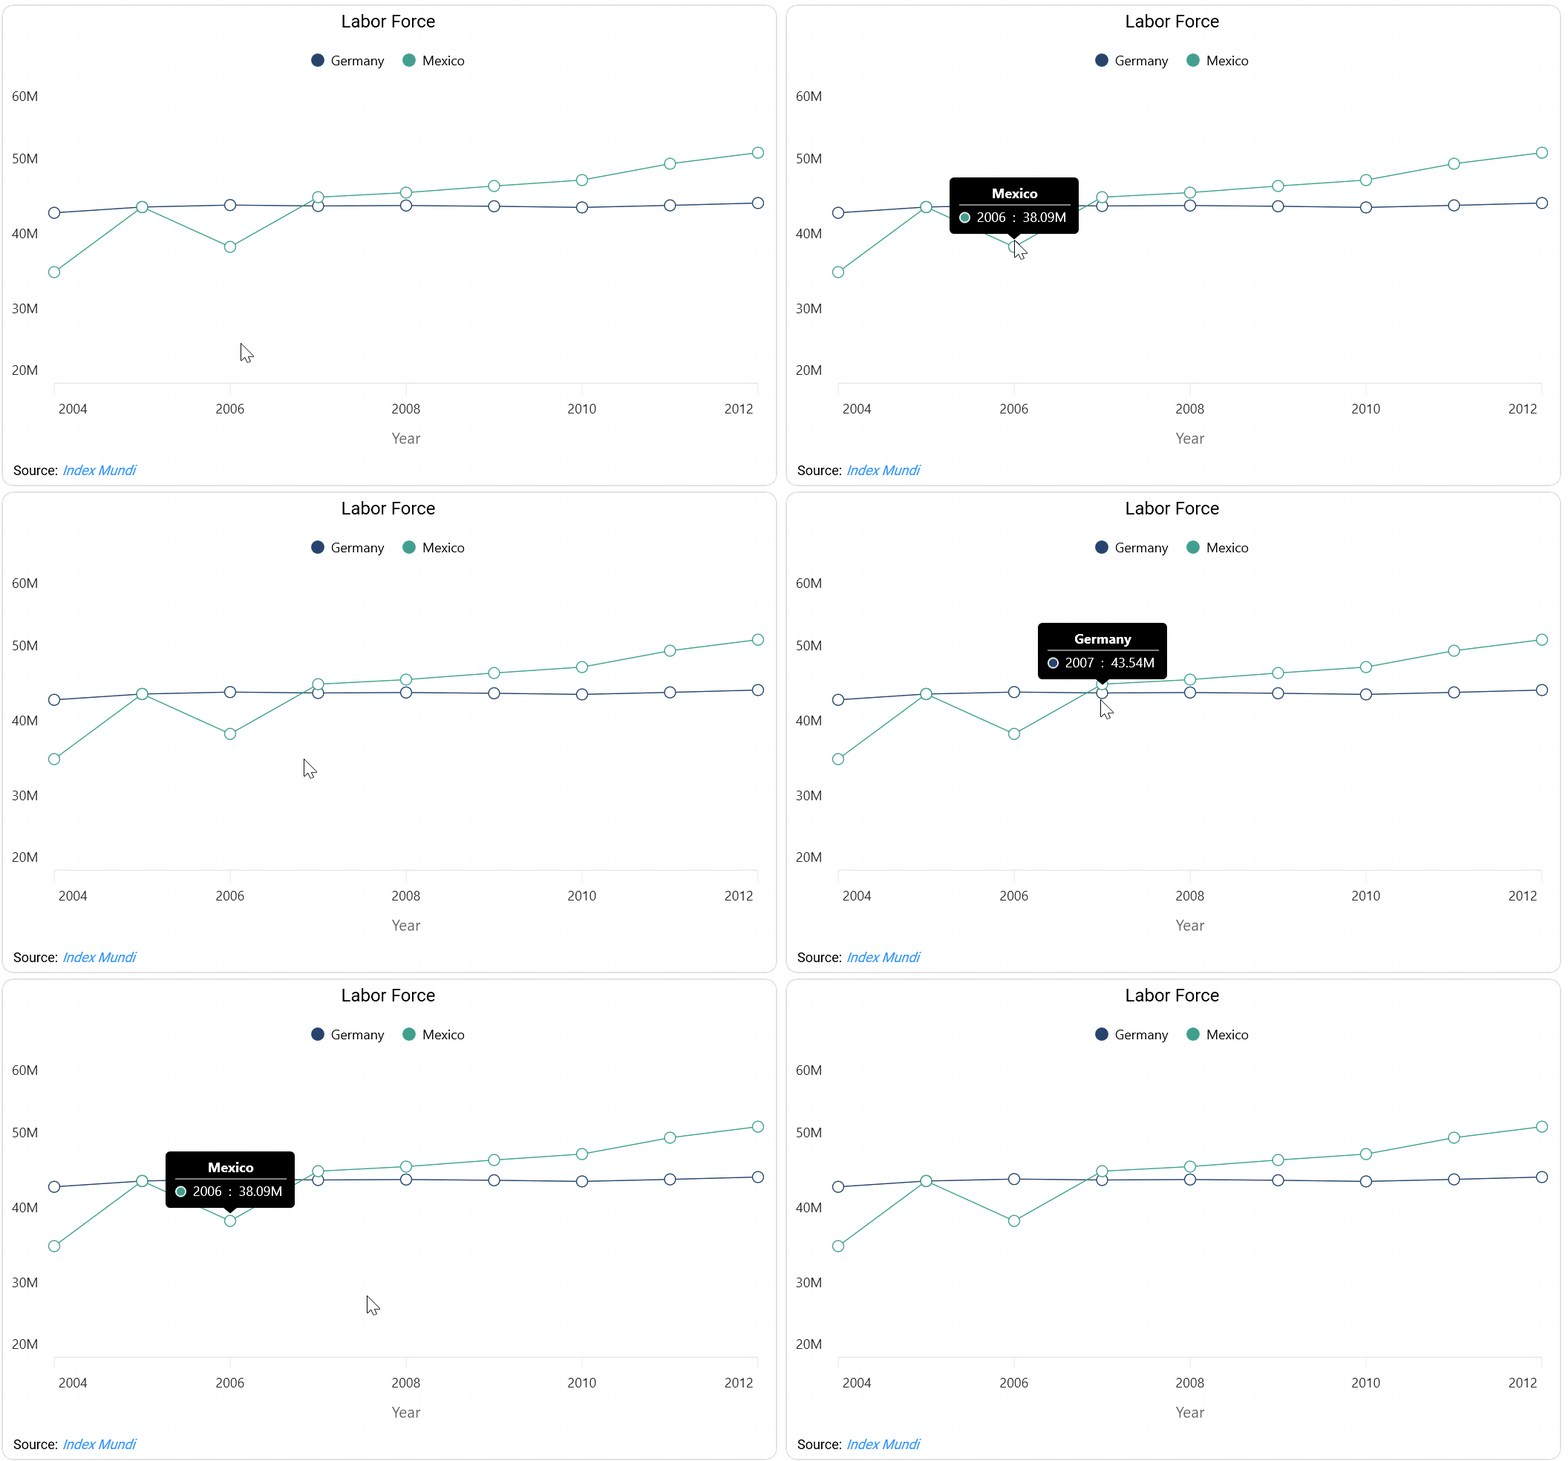
Tooltips Feature in .NET MAUI Charts
## Trackball
The [trackball](https://help.syncfusion.com/maui/cartesian-charts/trackball)
feature allows users to view and compare multiple data points on a chart. It is particularly useful for [fast-line](https://help.syncfusion.com/maui/cartesian-charts/fastline)
and [scatter](https://help.syncfusion.com/maui/cartesian-charts/scatter)
charts, allowing users to see the relationship between different data points. Users can use the trackball feature by long pressing on mobile devices or moving the pointer across the chart area on desktops.
The following code example demonstrates how to turn on the trackball feature.
```
. . .
```
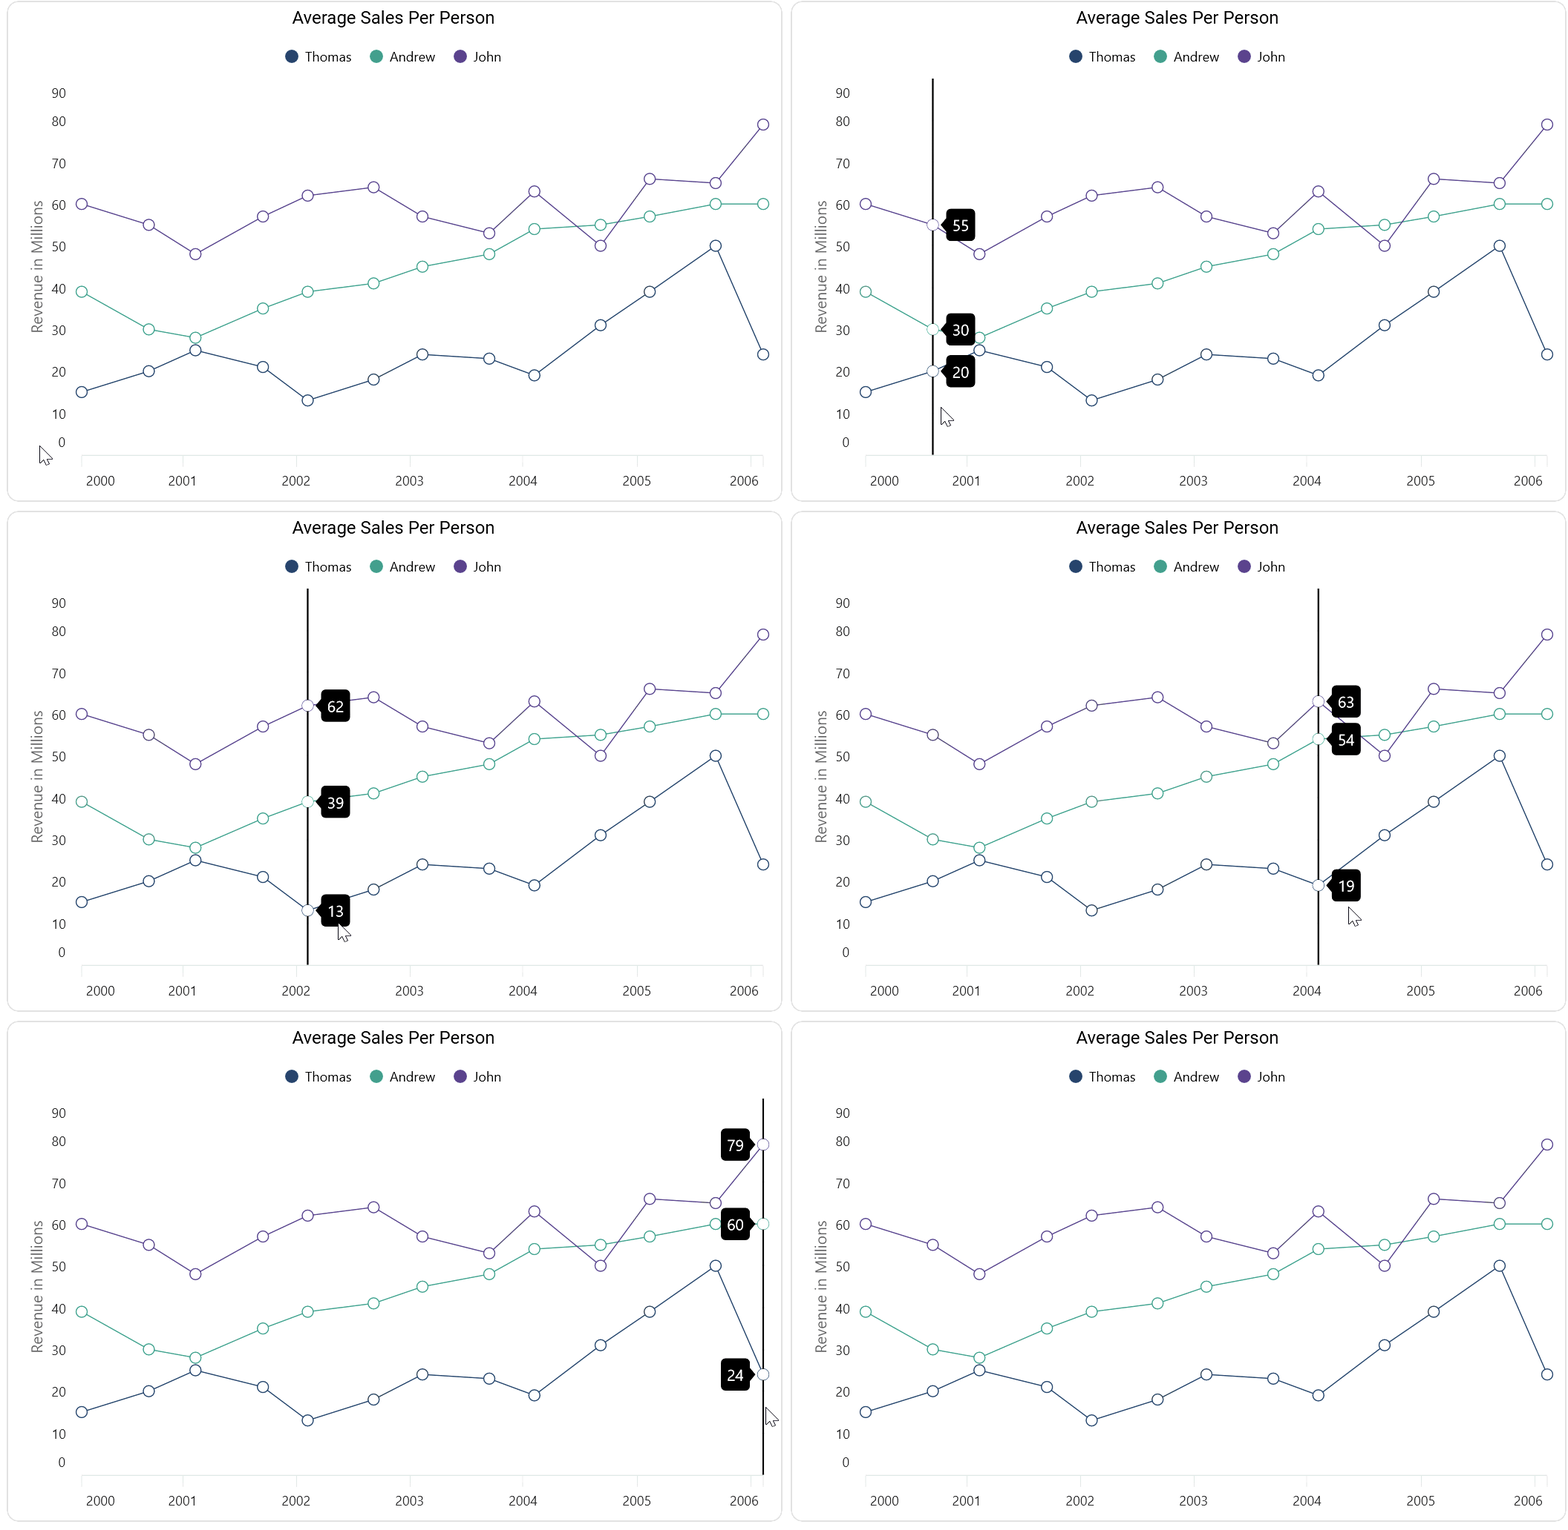
Trackball Feature in .NET MAUI Charts
## Selection
The [selection](https://help.syncfusion.com/maui/cartesian-charts/selection)
feature allows users to select and highlight specific data points or series on the chart and perform actions on them.
The following code example shows how to enable selection.
```
```
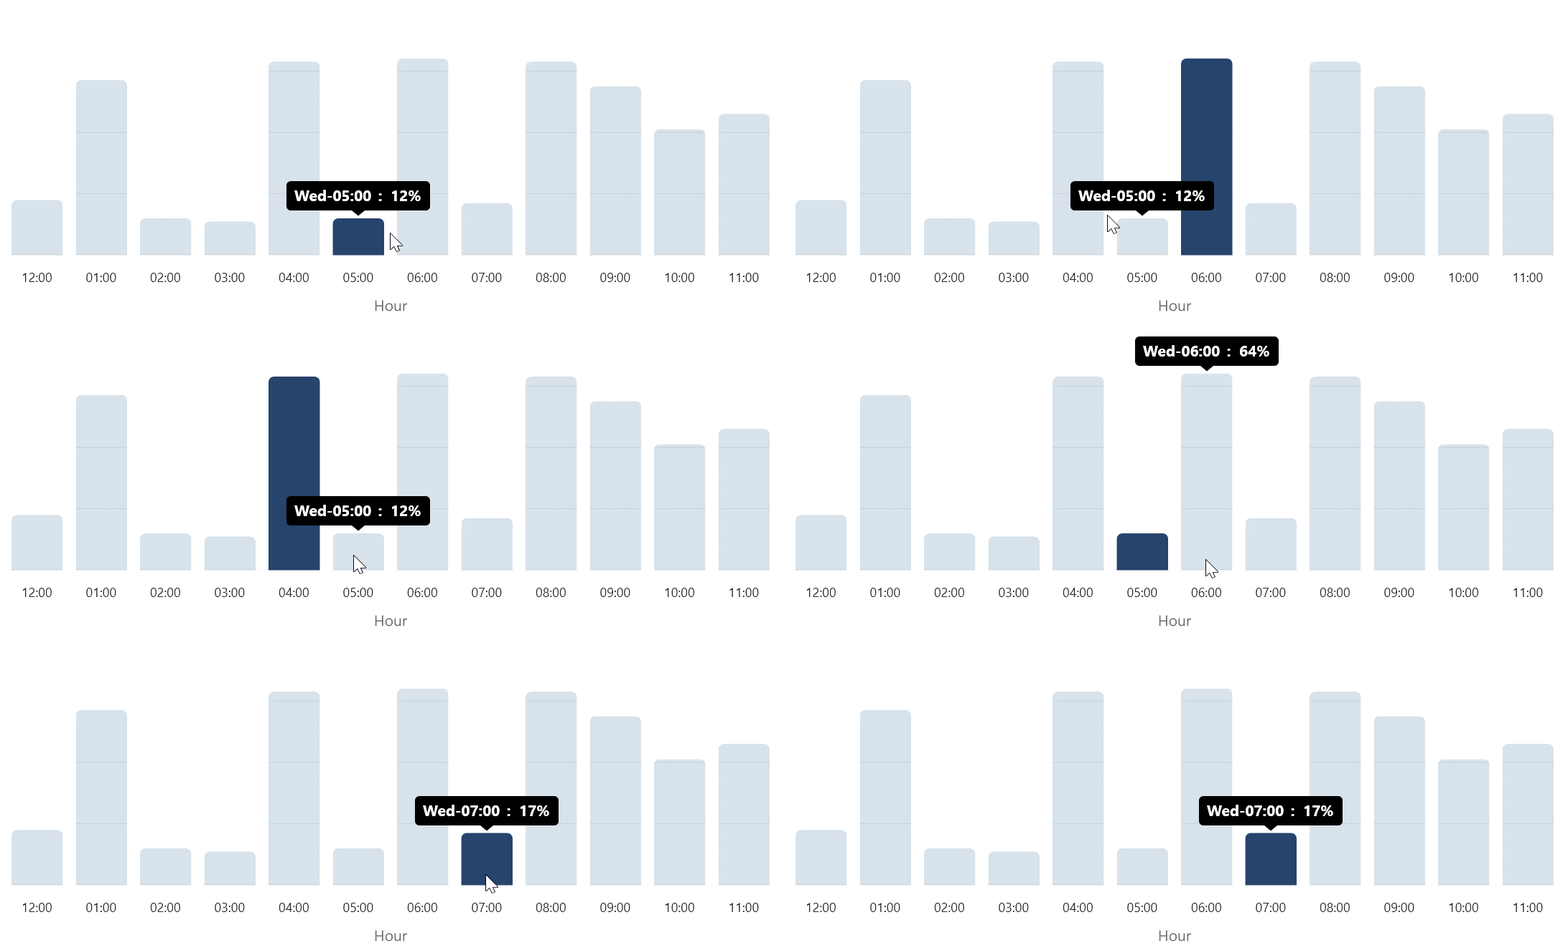
Selecting Data Points in .NET MAUI Charts
Using the selection feature, we can also implement the [drill-down](https://www.syncfusion.com/kb/13795/how-to-use-the-drill-down-functionality-in-net-maui-chart-sfcartesianchart)
function to navigate to another chart when tapping on a segment. This helps us show additional information about the selected data.
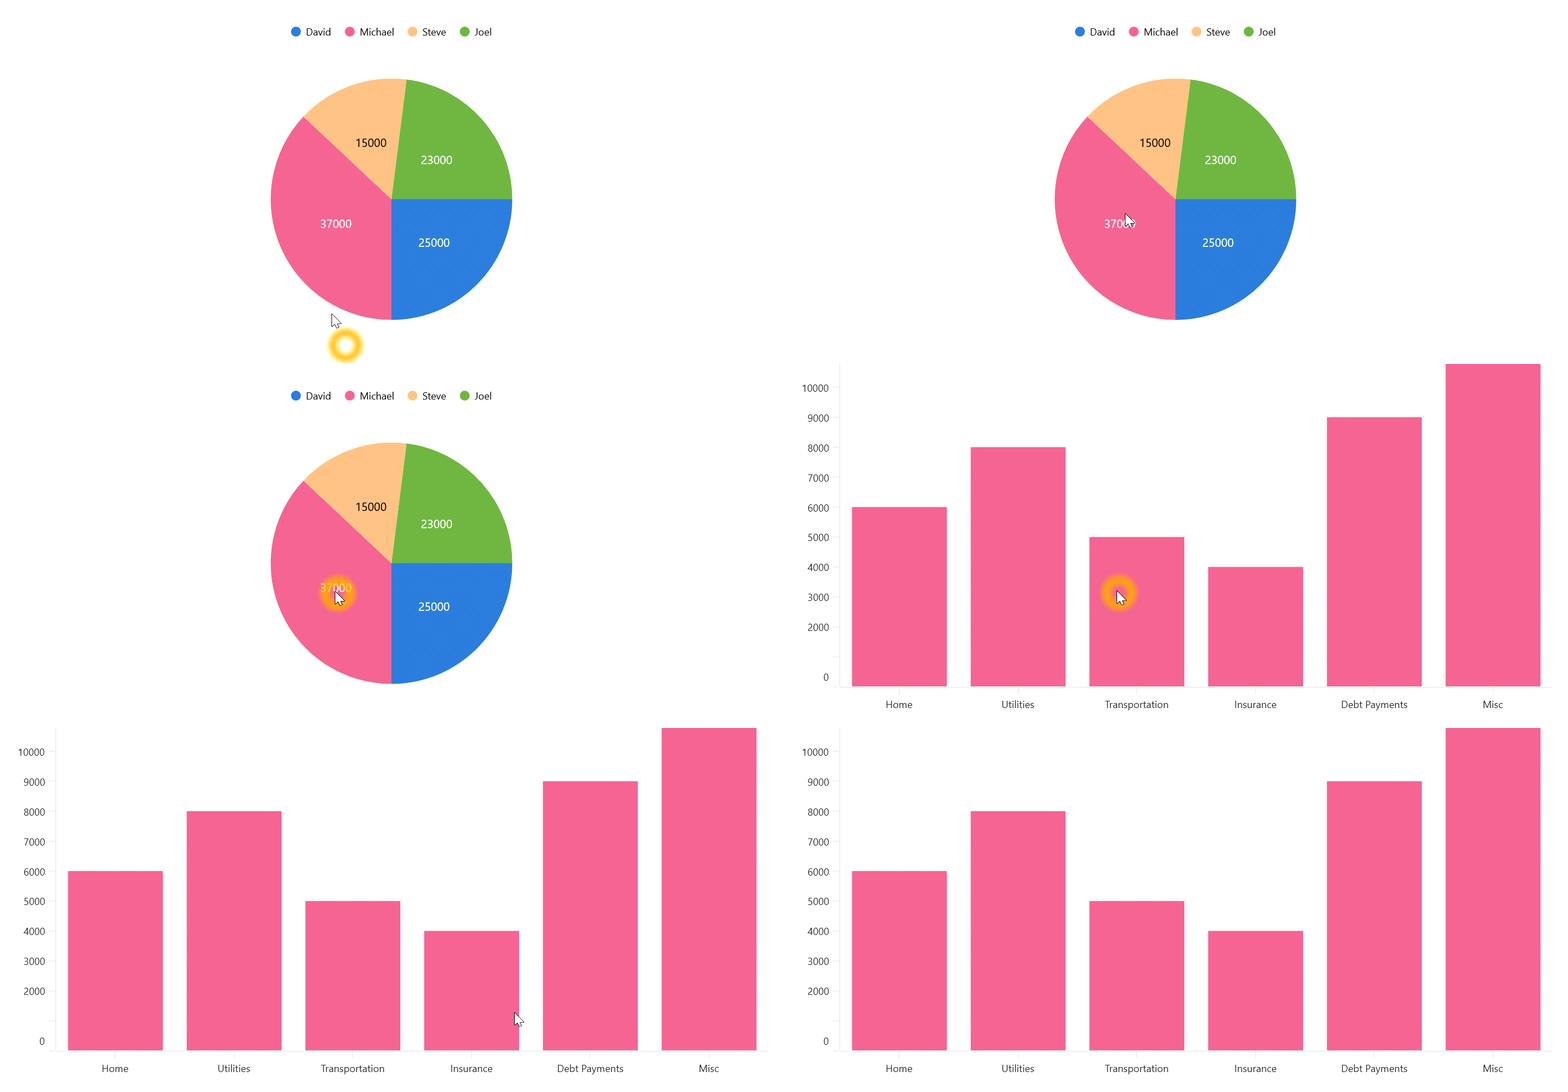
Drill-down Feature in .NET MAUI Charts
## Explode on touch
The [exploding on touch](https://www.syncfusion.com/kb/13872/how-to-explode-the-net-maui-doughnut-chart-data-points-sfcircularchart)
feature can be useful for highlighting a specific data point in a [pie](https://www.syncfusion.com/maui-controls/maui-circular-charts/chart-types/maui-pie-chart)
or [doughnut](https://www.syncfusion.com/maui-controls/maui-circular-charts/chart-types/maui-doughnut-chart)
chart. This feature allows users to explore a data point by just tapping or clicking on it.
Refer to the following code example to see how to turn this feature on.
```
```
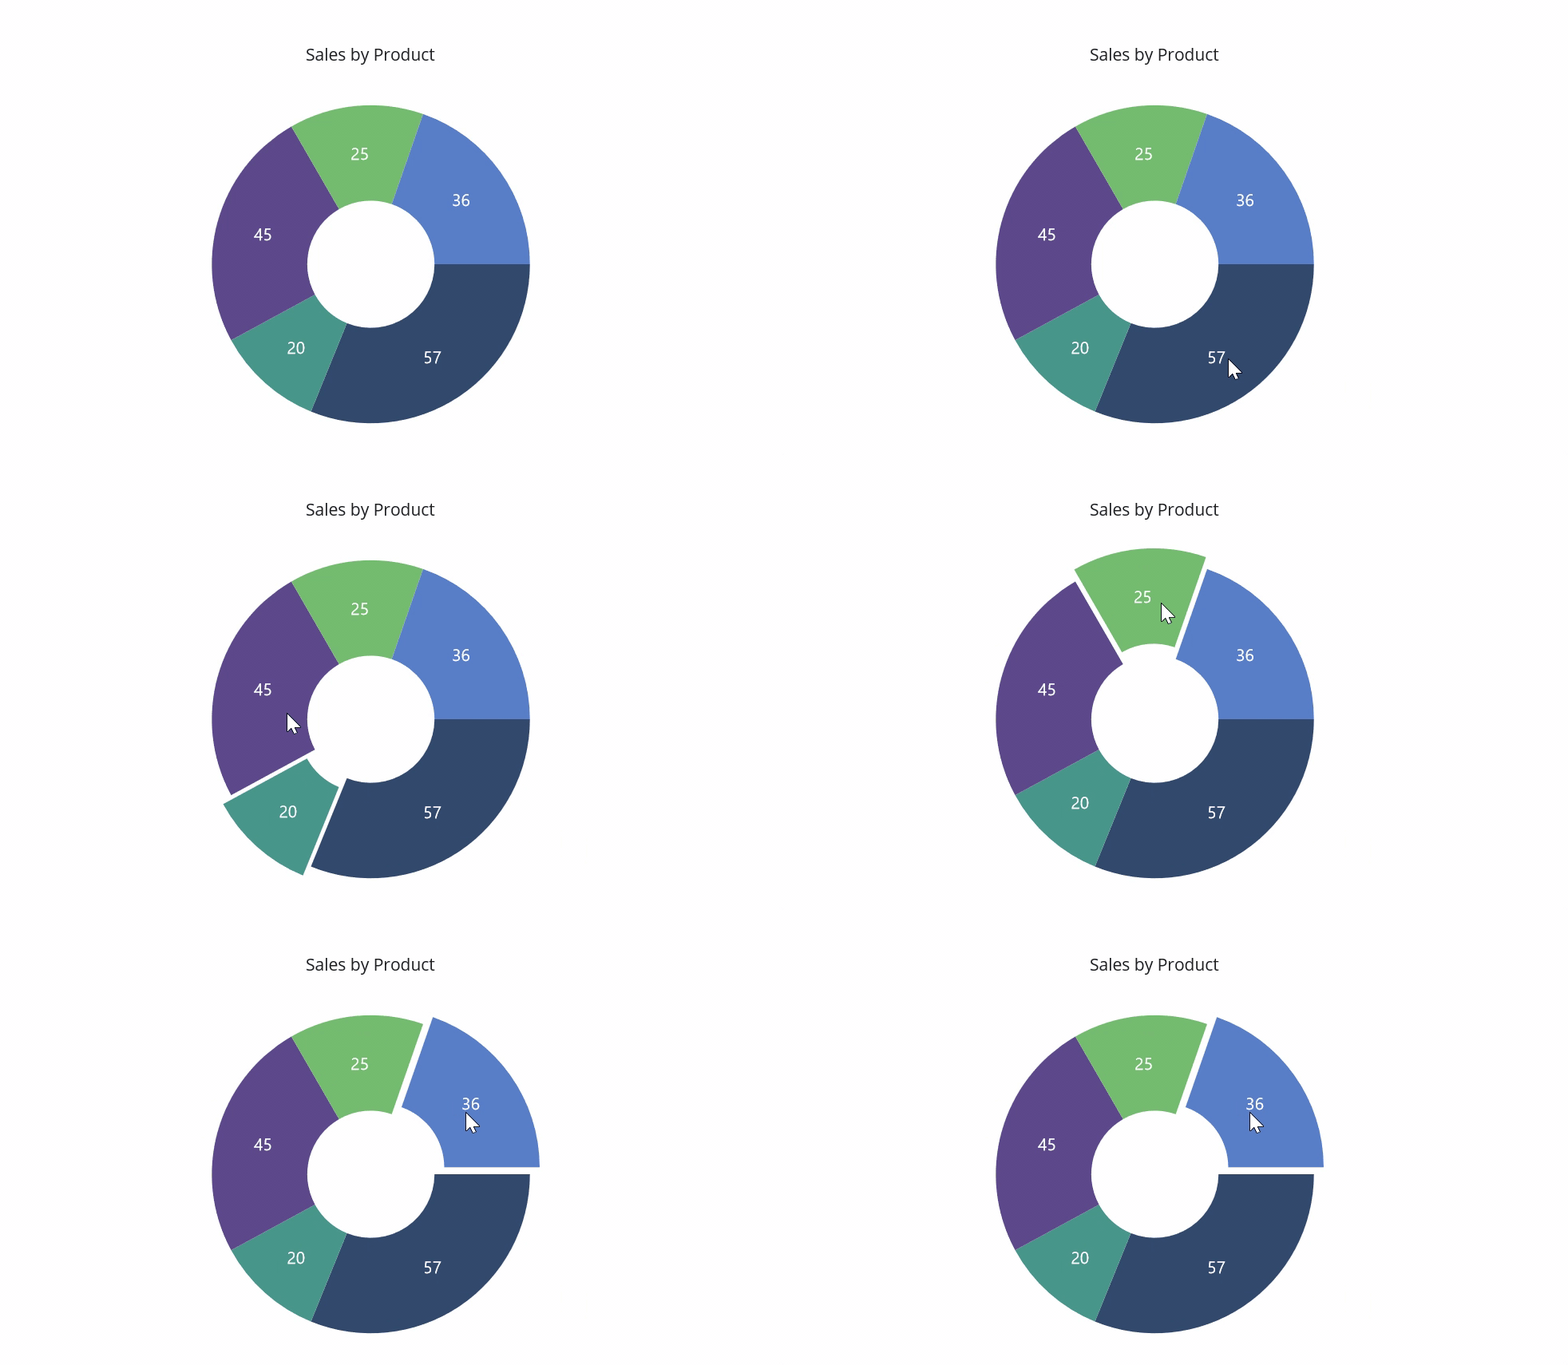
Exploding on Touch Feature in .NET MAUI Doughnut Chart
## Zooming and panning
The [zooming and panning](https://help.syncfusion.com/maui/cartesian-charts/zooming-and-panning)
feature allows users to zoom in and out of specific parts of a chart and pan around the chart to view different sections. This is particularly useful for large datasets or charts with many data points.
Refer to the following code example to enable this feature.
```
```
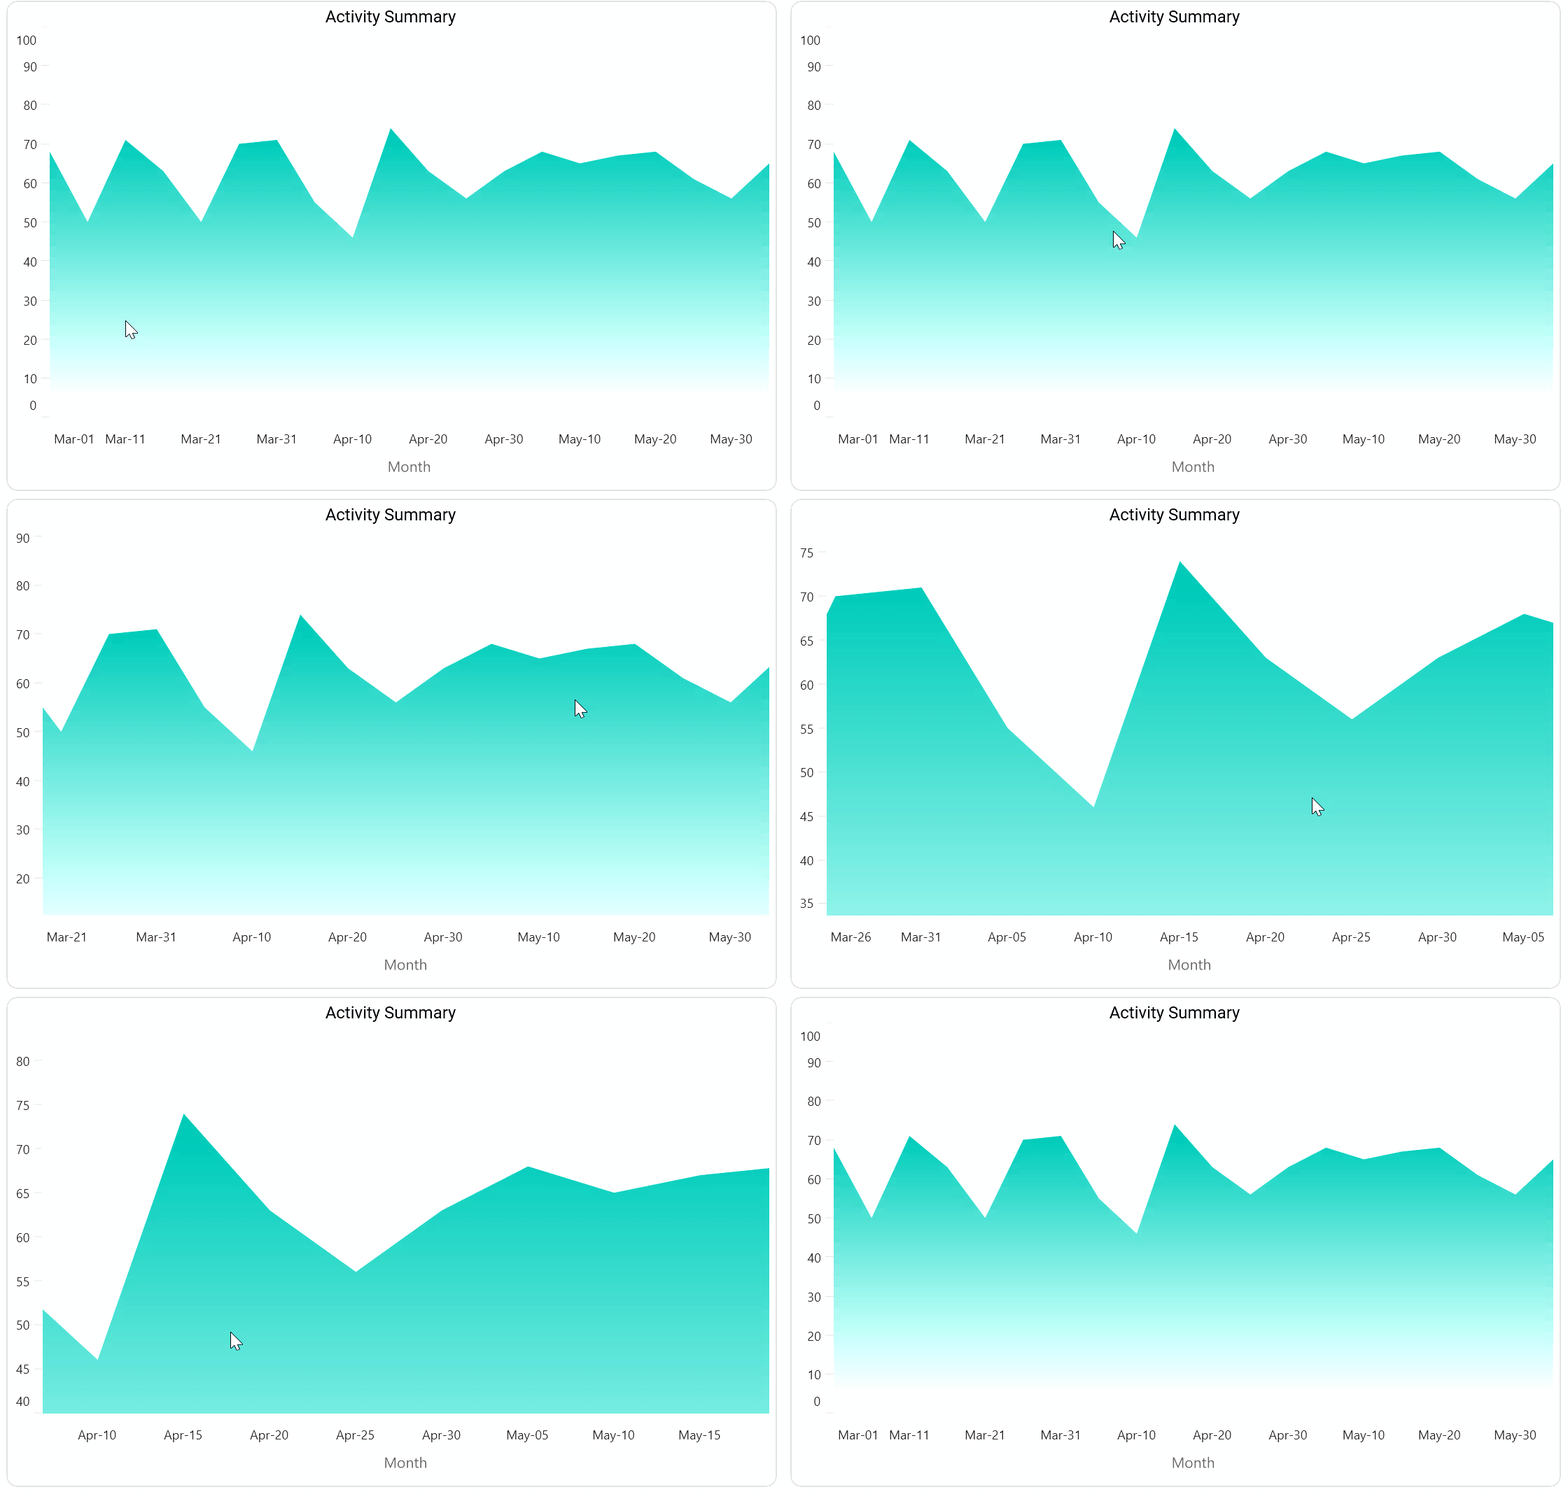
Zooming and Panning Feature in .NET MAUI Charts
## Conclusion
Thanks for reading! In this blog, we explored the interactive features of [Syncfusion’s .NET MAUI Charts](https://www.syncfusion.com/maui-controls/maui-cartesian-charts)
. Use these features to enhance your charting experience. Also, try out our .NET MAUI control demos available on [GitHub](https://github.com/syncfusion/maui-demos)
and leave your feedback in the comments section at the end of this blog.
If you’re not a Syncfusion customer, start a 30-day [free trial](https://www.syncfusion.com/downloads)
to see how our components can benefit your projects.
You can also contact us through our [support forum](https://www.syncfusion.com/forums)
, [support portal](https://support.syncfusion.com/)
, or [feedback portal](https://www.syncfusion.com/feedback/home)
. We are always happy to assist you!
## Related blogs
- [Easily Design a Group Box View in .NET MAUI](https://www.syncfusion.com/blogs/post/group-box-view-in-dotnet-maui.aspx)
- [Easily Develop a Travel Destination Listing UI in .NET MAUI](https://www.syncfusion.com/blogs/post/travel-destination-listing-ui-in-dotnet-maui.aspx)
- [Designing Effective Data Entry Forms in .NET MAUI: A Step-By-Step Guide](https://www.syncfusion.com/blogs/post/designing-effective-data-entry-forms-in-net-maui-a-step-by-step-guide.aspx)