The Syncfusion Blazor Gantt Chart is a project planning and management tool. Its rich feature set helps us display and manage hierarchical tasks with timeline details.
Though many of the component’s features are necessary for the convenience of users, the performance of the component also plays a vital role, especially while handling a huge volume of data with a longer timeline data source.
So, to effectively handle a huge data set, we have provided virtualization support in our Blazor Gantt Chart to load DOM (Document Object Model) elements on demand. This will enhance the performance of the browser engine while rendering our Gantt Chart component.
In this blog, we’ll see the various virtualization features available in our Blazor Gantt Chart component and how they help in boosting performance.
Virtualization in Blazor Gantt Chart
As I said before, virtualization renders only the DOM elements required in the current viewport. After that, it will dynamically render the subsequent elements during horizontal and vertical scrolling on demand.
You can enable virtualization for both horizontal and vertical scrolling in the grid and chart areas of the Gantt Chart.
The virtualization types supported in the Blazor Gantt Chart component are:
- Row virtualization: For both the grid and chart areas while scrolling vertically.
- Column virtualization: For the grid area while scrolling horizontally.
- Timeline virtualization (data that is scheduled between longer periods): For the chart area while scrolling horizontally.
Let’s see them in action!
Row virtualization
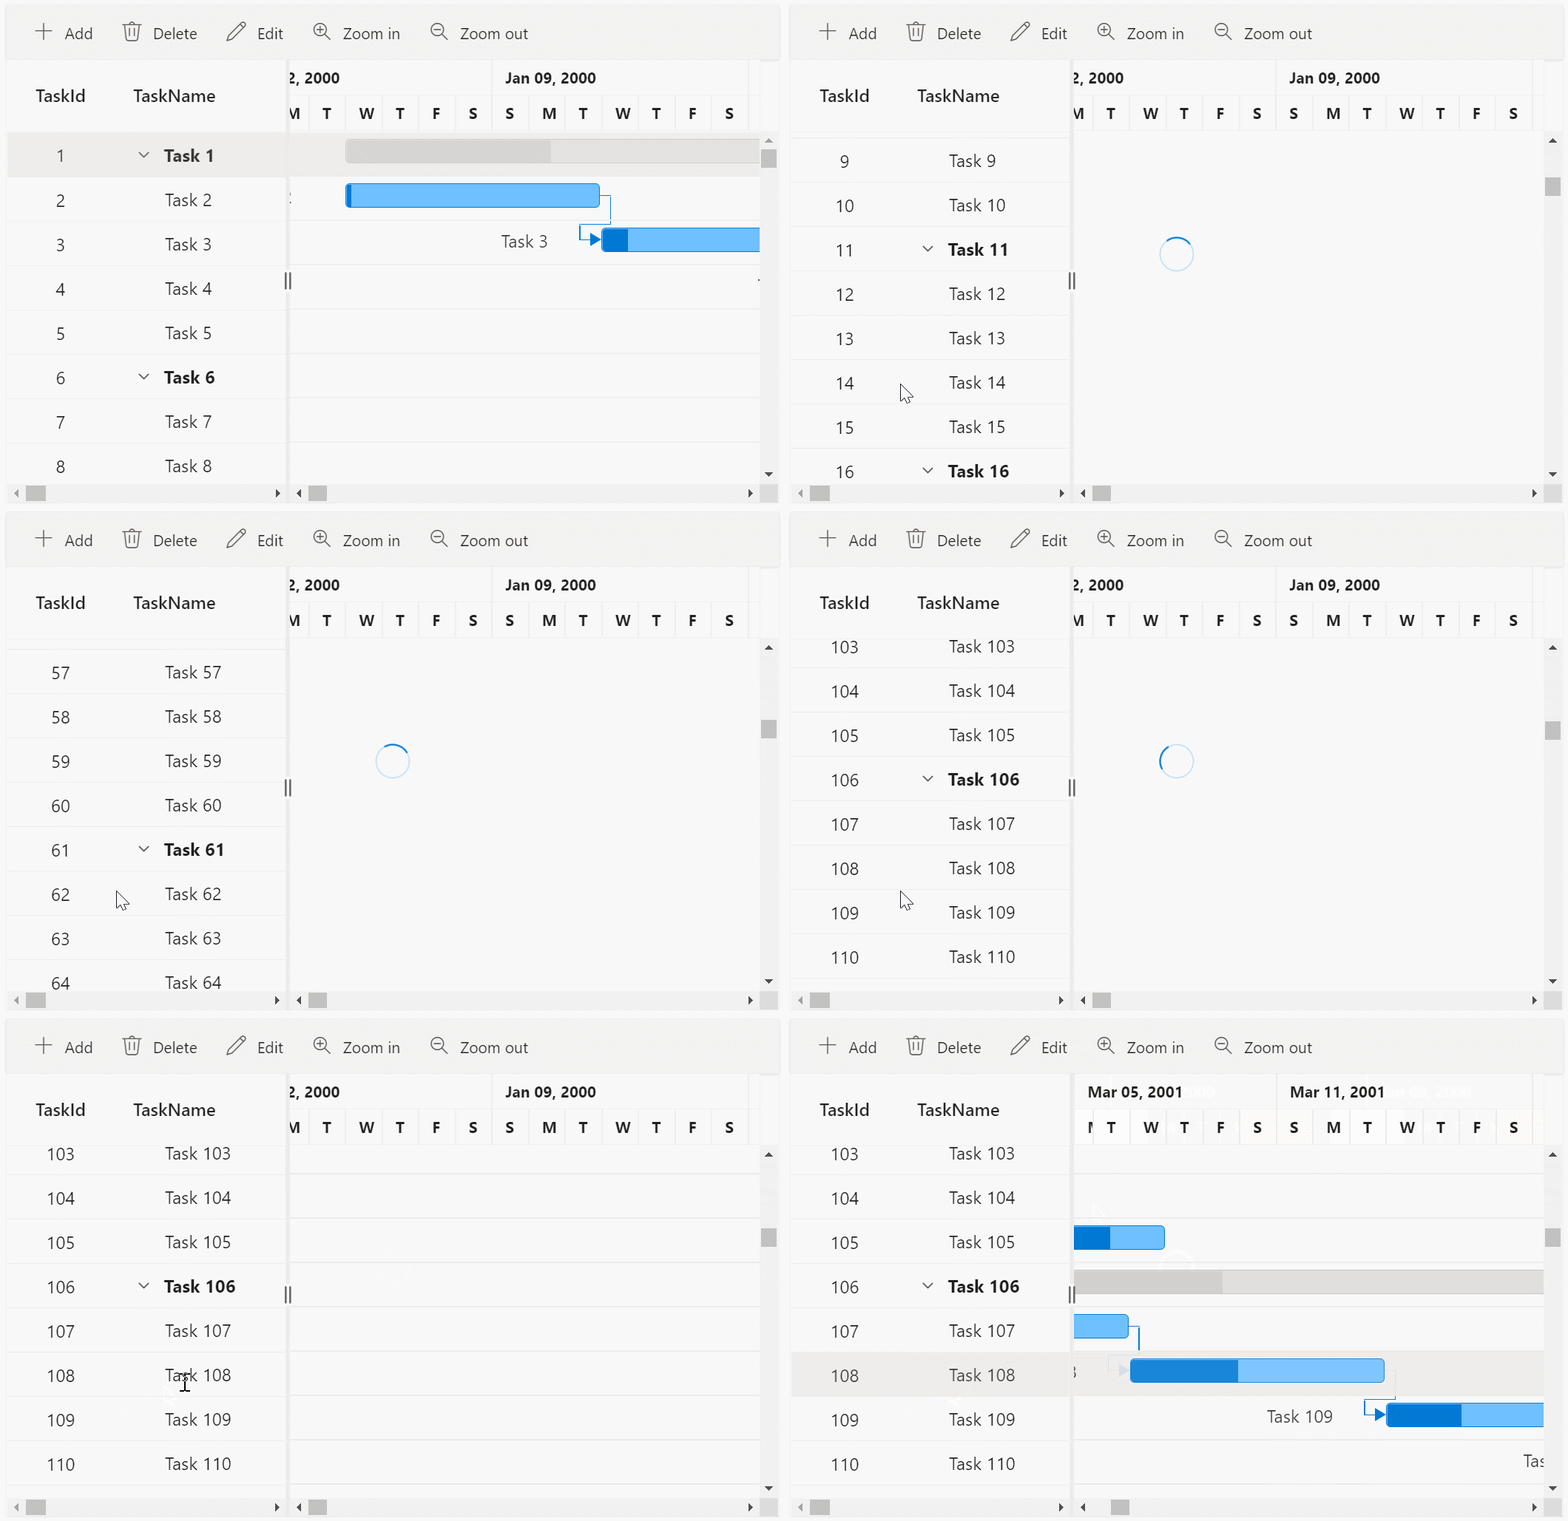
With the help of row virtualization, we can effectively bind and visualize a huge data set with thousands of records. Initially, it will only render the current viewport rows in the DOM for the grid and chart areas. On vertical scrolling, it will render further rows on demand, thus enhancing the performance of the Blazor Gantt Chart.
Refer to the following GIF image.
Column virtualization
Consider a scenario where we need to bind a data source with many column fields in each data object. In that case, not only does the number of records in the data source affect the performance, but the number of fields or columns in each data source also affects the performance because it increases the number of cell elements being rendered in the DOM.
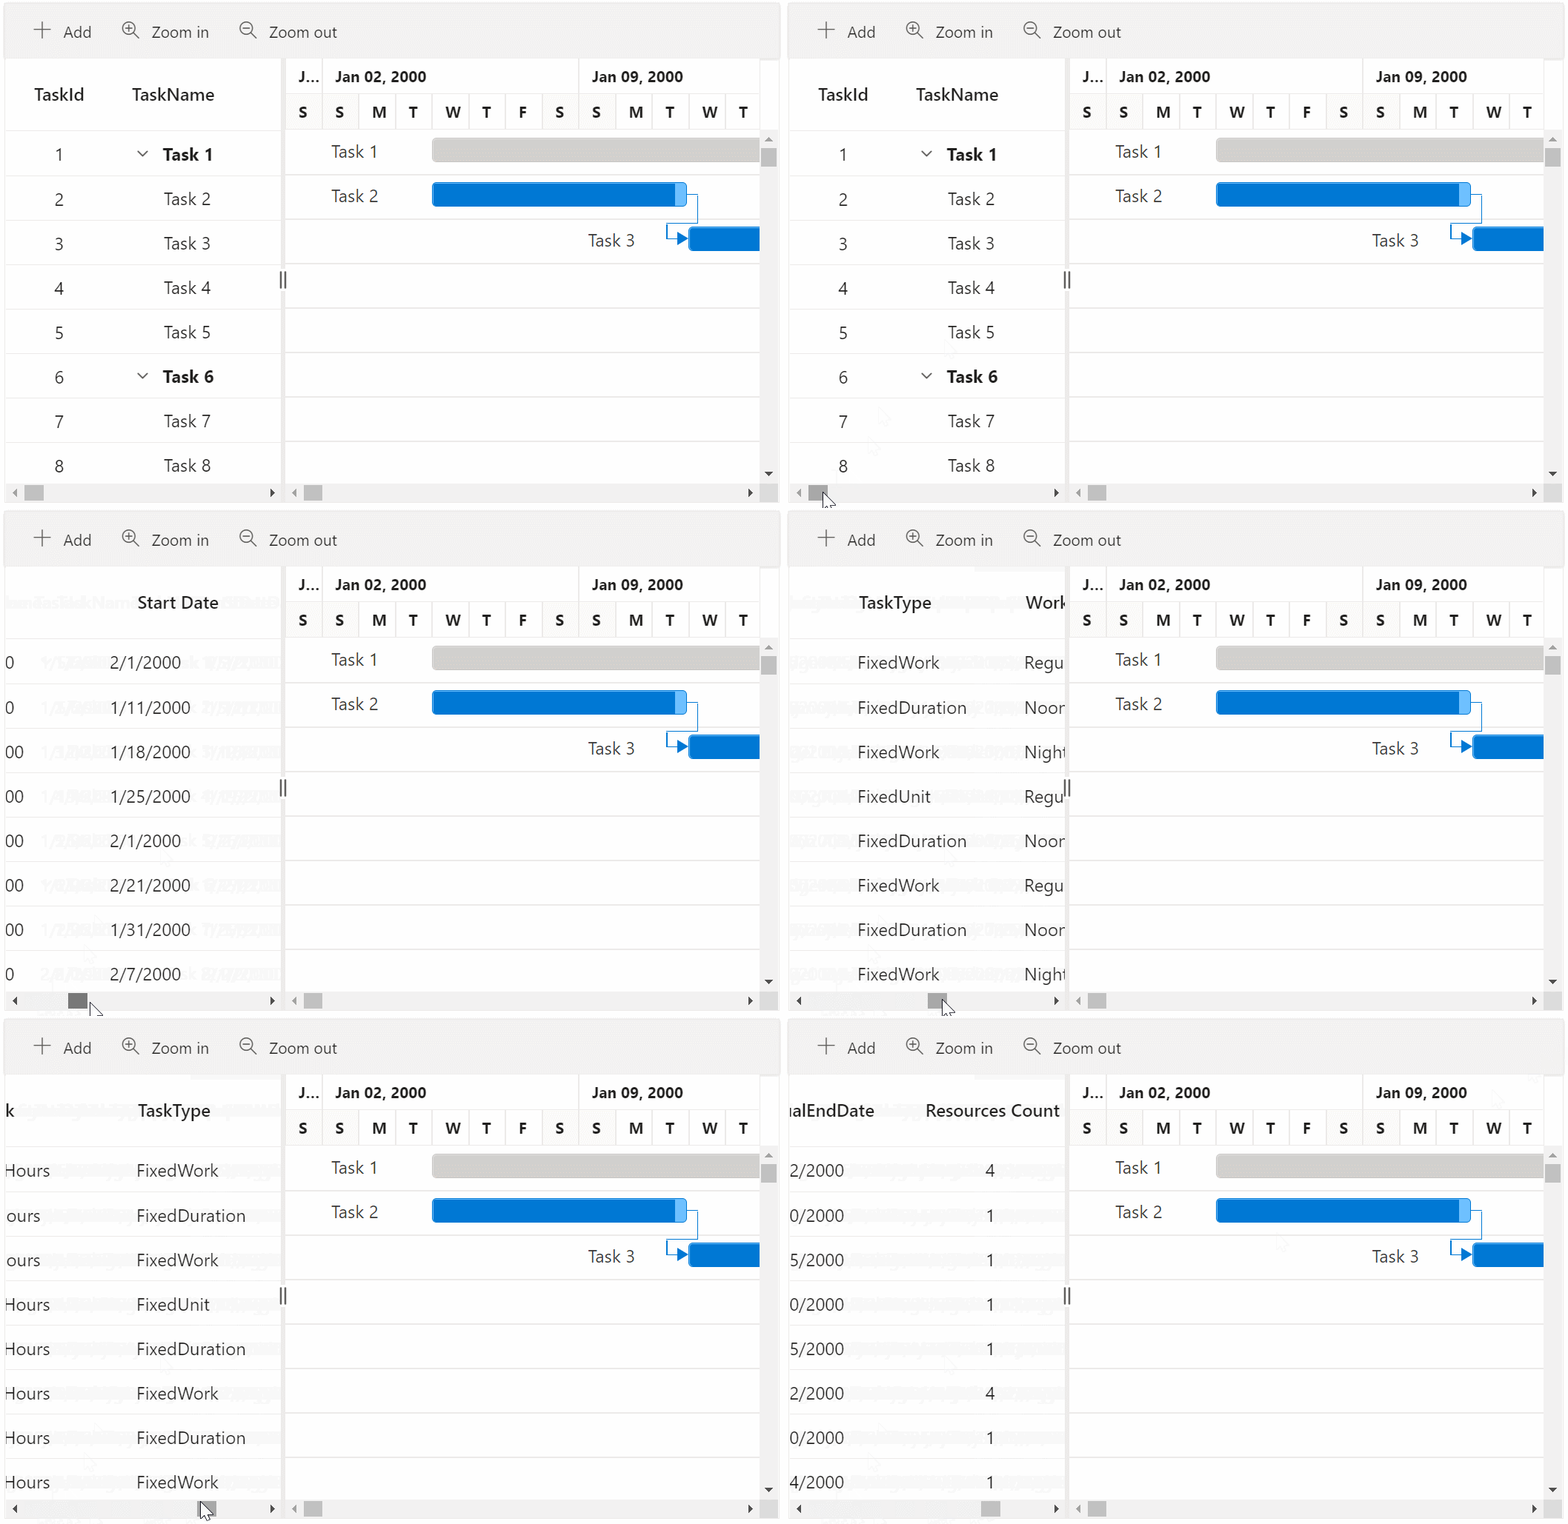
So, in this case, we can enable column virtualization in the Blazor Gantt Chart. It will render only the current viewport grid cells in the DOM and render the remaining cells on demand while scrolling horizontally. In this way, it enhances the performance of the Blazor Gantt Chart.
Refer to the following GIF image.
Timeline virtualization
Like column virtualization in the grid area, we can enable timeline virtualization in the chart area of the Blazor Gantt Chart to schedule tasks with longer periods.
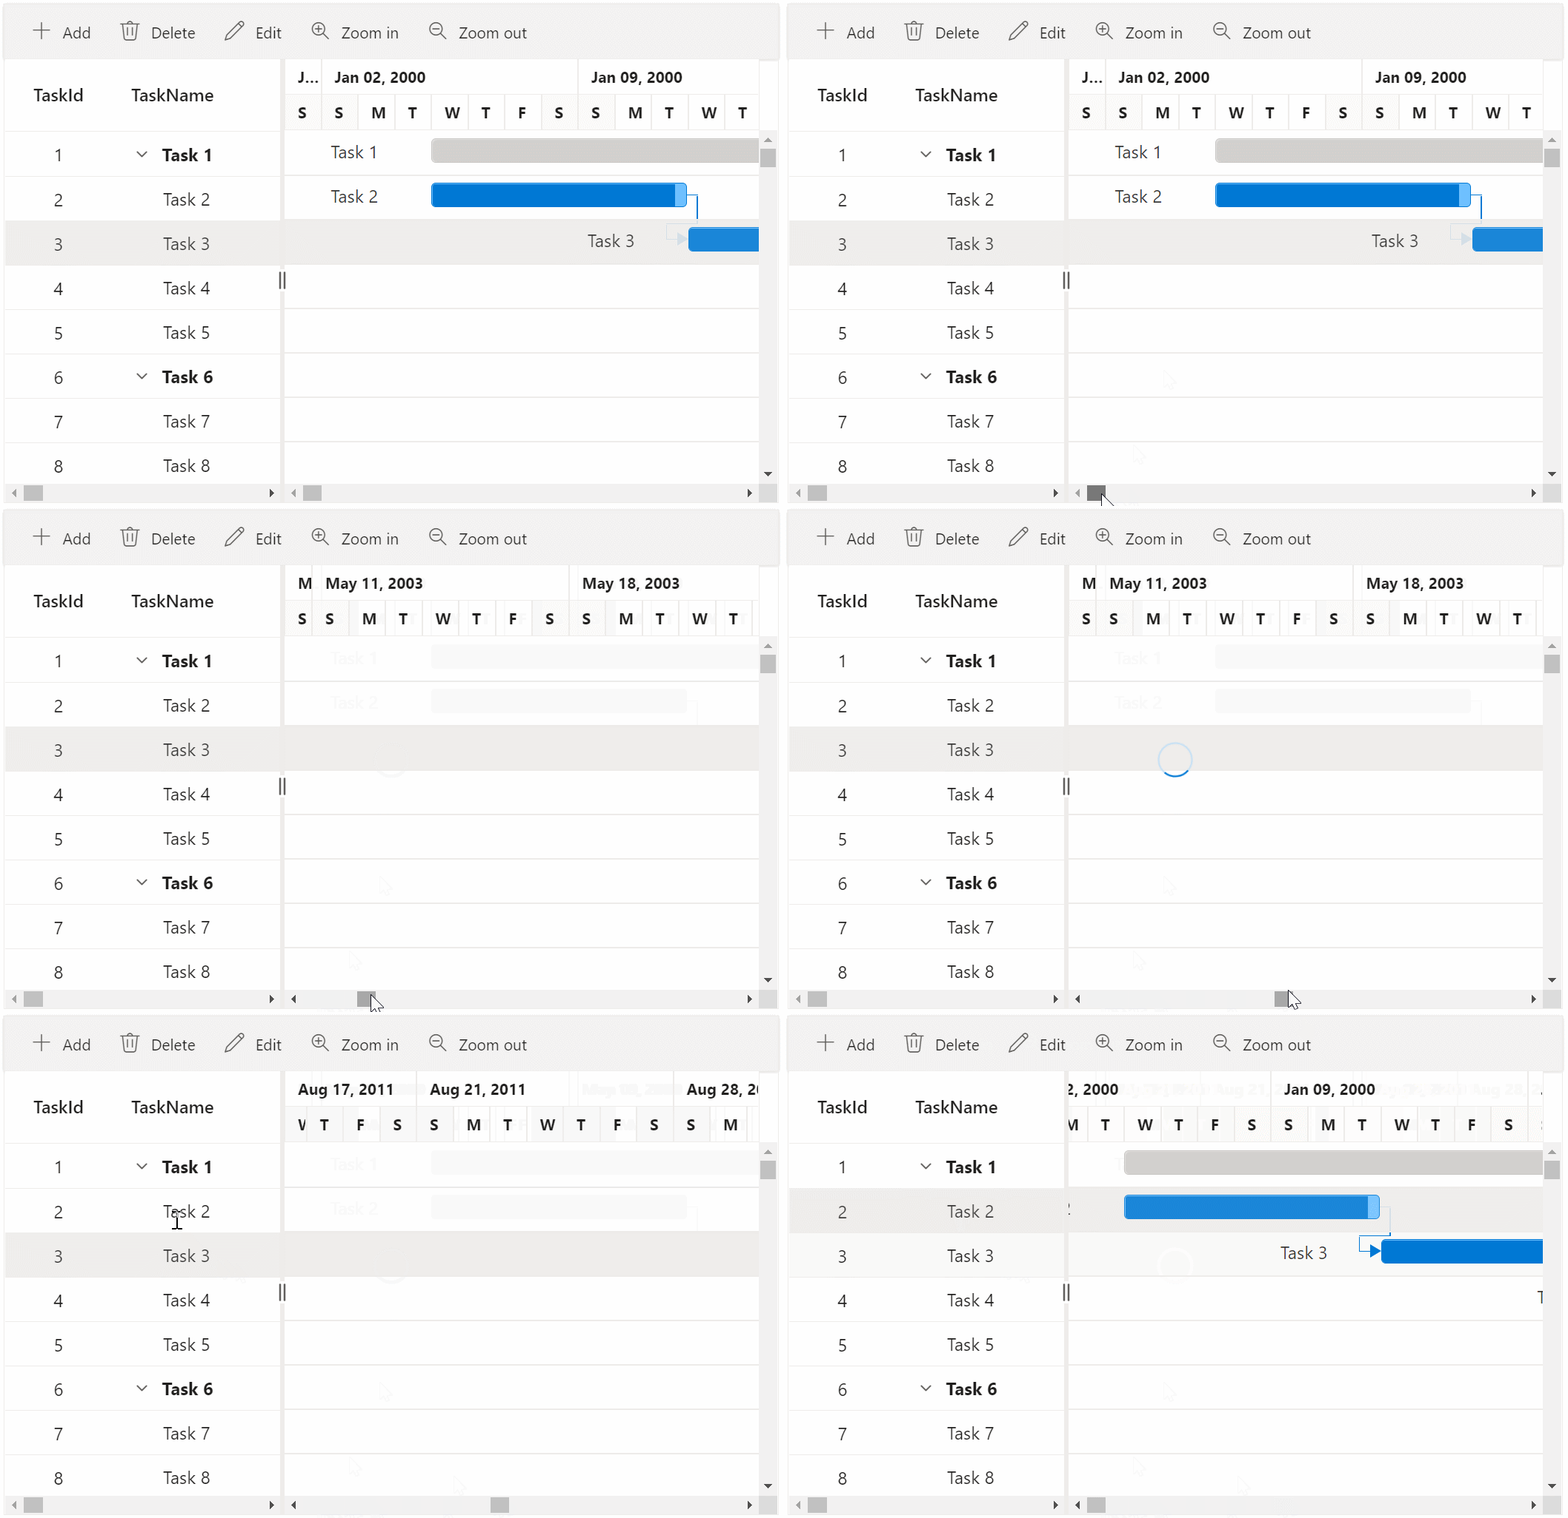
For tasks with longer periods, a greater number of cells needs to be rendered in the timeline, which may result in performance deterioration. Timeline virtualization reduces this cell rendering burden by loading the timeline cells required for the current viewport alone. All other cells will be rendered on demand while scrolling horizontally.
Refer to the following GIF image.
Performance metrics
Let’s compare the performance metrics for rendering 10,000 records with and without virtualization enabled in the Blazor Gantt Chart.
| Without Virtualization (Normal Scrolling) | With Virtualization (Row, Column, and Timeline) |
| 4 minutes 52 seconds | 10 seconds |
From the above table data, it is evident that with virtualization, the performance of the Blazor Gantt Chart can be drastically enhanced.
Reference
For more details, refer to the virtual scrolling in Blazor Gantt Chart demo and documentation. Syncfusion Blazor components can be transformed into stunning and efficient web apps.

Conclusion
Thanks for reading! In this blog, we have seen how virtualization helps in boosting performance by reducing the DOM elements in our Blazor Gantt Chart. Try out this marvelous feature and share your valuable feedback in the comments below.
You can also contact us through our support forum, support portal, or feedback portal. We are always happy to assist you!





Comments (1)
Dear Alan !
We are really, really looking forward to working with virtualization with the Gantt Chart !
Comments are closed.