---
title: "Easily Automate Flowchart Creation in React Diagram"
published_at: "2024-10-24T10:06:58+00:00"
modified_at: "2025-12-22T13:39:46+00:00"
url: "https://www.syncfusion.com/blogs/post/automate-flowchart-creation-in-react"
excerpt: "This blog explains how to automate flowchart creation in Syncfusion React Diagram Library with code examples."
taxonomy_category:
- "Development"
- "React"
- "Syncfusion"
- "UI"
- "Web"
taxonomy_post_tag:
- "development"
- "diagram"
- "flow-charts"
- "productivity"
- "React"
- "Web"
- "What's New"
---
# Easily Automate Flowchart Creation in React Diagram
[Sivaranjith Jeyabalan](https://www.syncfusion.com/blogs/author/sivaranjith-jeyabalan)
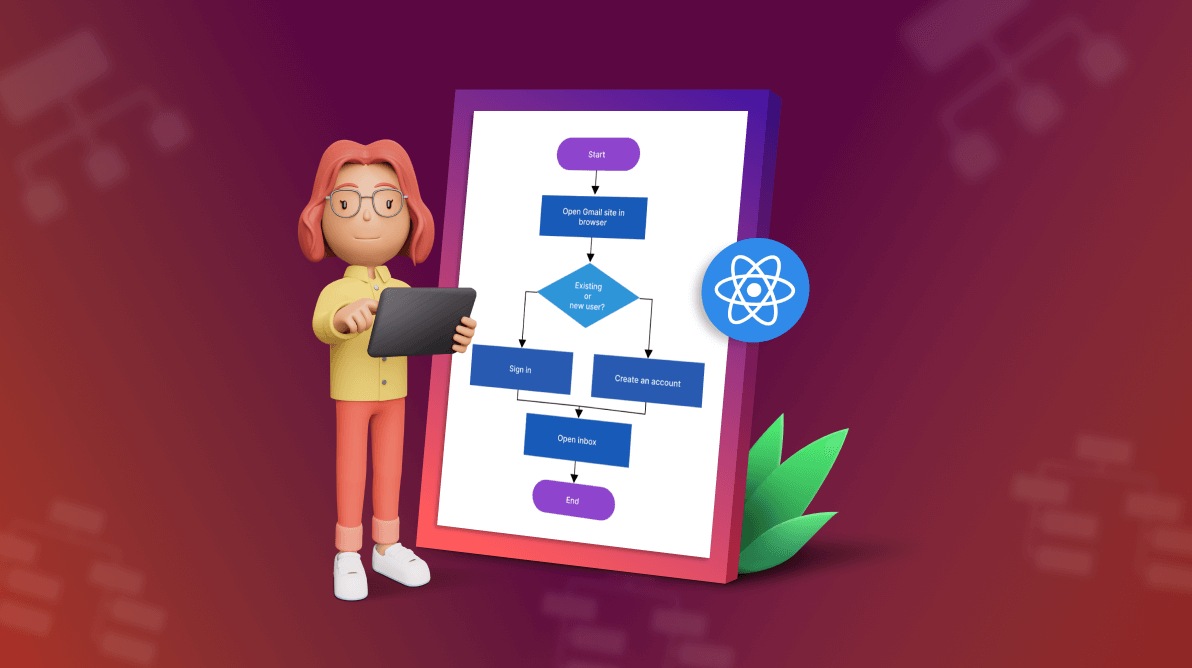
**TL;DR:** Learn how to automate flowchart creation in your React apps using Syncfusion React Diagram, eliminating the need for manual positioning. Generate flowcharts from external data, customize designs, and utilize features like zooming, panning, and serialization for enhanced interactivity. Streamline your workflows and enhance clarity with this powerful tool!
Manually assigning coordinates to flowchart elements is time-consuming and prone to errors. The [Syncfusion React Diagram](https://www.syncfusion.com/react-components/react-diagram)
library provides a simplified approach with minimal configuration, enabling you to focus on your data rather than precise element positioning.
In this blog, we’ll demonstrate how to automate flowchart creation using Syncfusion’s Diagram component, eliminating manual placements by leveraging its built-in automatic layout algorithm.
## What is a flowchart?
The [Flowcharts](https://en.wikipedia.org/wiki/Flowchart)
are powerful tools for visually representing processes, workflows, systems, or algorithms. They use distinct symbols for various actions or steps, connected by arrows that indicate the control flow. With Syncfusion’s React Diagram, you can effortlessly generate these diagrams from external data, simplifying your workflow and enhancing clarity.
## Common flowchart symbols and their meanings
Flowchart symbols are integral to visualizing different stages and operations within a process. Each symbol carries a specific meaning, representing distinct tasks, decisions, or data operations. The following table outlines the most commonly used flowchart symbols and their functions in illustrating processes.
| Symbol | Name | Description |
| --- | --- | --- |
| | Terminator | Indicates the beginning or end of a process. |
| | Data | Represents the input or output of data within a process. |
| | Process | Denotes an operation, task, or data manipulation performed within the process. |
| | Decision | Indicates a decision point where the process can branch into two or more paths based on conditions. |
| | Document | Represents a single document or report generated or referenced in the process. |
| | Predefined Process | Signifies a predefined set of operations, often represented elsewhere, that completes a specific task. |
| | Internal Storage | Represents the internal storage of data. |
| | Direct Data | Represents a dataset that can be searched, sorted, or filtered for information. |
| | Stored Data | Indicates a step where data is stored within the process for future use or reference. |
| | Sequential Data | Represents data that must be accessed sequentially. |
| | Sort | Represents a step that organizes list of items sequentially. |
| | Paper Tap | Represents a step where data gets stored within a process. |
| | Manual Input | Represents manual data entry at a specific point in the process. |
| | Manual Operation | Represents an action or task that requires manual execution rather than an automated process. |
| | Preparation | Indicates a setup or preparatory phase before transitioning to another step. |
| | Off-Page Reference | Links parts of a flowchart that continue on another page, often used in complex processes. |
| | Multi-Document | Represents multiple documents or reports involved at a given point in the process. |
| | Card | Represents a data card or punched card used for data entry or storage. |
| | Summing Junction | Represents the logical AND (merge multiple inputs into a single output). |
| | Or | Represents the logical OR. |
| | Merge | Represents a step where two or more sub-lists or sub-processes become one. |
| | Extract | Represents retrieving data from a source for further processing or analysis in a flowchart. |
| | Delay | Represents a period of delay in a process. |
| | Collate | Represents gathering and arranging data or documents from multiple sources into a structured format. |
| | Annotation | Represents additional information and clarifications about a process or decision point in the flowchart. |
| | Annotation 2 | Represents additional comments or notes about a process in the flowchart. |
| | Sequential Access Storage | Represents information that is stored in a sequential manner. |
| | Display | Represents information or data being shown on a screen or printed for the user’s review. |
| | Loop Limit | Represents the maximum number of times a particular process or operation can be repeated within a loop. |
| | Flowline | Depicts the flow or direction from one step to the next. These lines are automatically created based on relationships between parent and child elements. |
## Getting started with a simple flowchart
In this section, we’ll create a simple flowchart using the [Syncfusion React Diagram](https://help.syncfusion.com/reactjs/diagram/overview)
library. By leveraging its built-in, high-performance layout algorithm, we can automatically arrange flowchart symbols, eliminating the need to set coordinates manually.
In addition, the diagram control supports visualizing flowcharts directly from a data source. Let’s get started
### Step 1: Define the data source
To populate the flowchart in the diagram, we need to define a data source or a collection of nodes. Within the flowchart layout, you can specify the desired shape, style, labels for nodes, connectors, and decorator types for connectors directly in the data source, enhancing the UI design.
#### Field definitions
- **name**: Represents the annotation displayed on the node.
- **shape**: Defines the node’s shape (e.g., Terminator, Process).
- **color**: Specifies the fill color of the node.
- **stroke**: Defines the border color of the node.
- **strokeWidth**: Specifies the border thickness of the node.
- **label**: Adds annotations to the incoming connectors.
- **arrowType**: Determines the arrowhead type (decorator) of the incoming connector (e.g., Diamond, Fletch).
This structure allows for easy customization of the flowchart’s visual elements based on the provided data source.
The following code example defines a data source, along with custom fields that fit the flowchart requirements.
```
//Initializes the data source for the layout
public data = [
{
id: '1',
name: 'Start',
shape: 'Terminator',
color: '#8E44CC',
},
{
id: '2',
name: 'Open Gmail site in browser',
parentId: ['1'],
shape: 'Rectangle',
color: '#1759B7',
},
{
id: '3',
name: 'Existing \nor \n new user?',
parentId: ['2'],
shape: 'Decision',
color: '#2F95D8',
},
{
id: '4',
name: 'Create an account',
label: ['New'],
parentId: ['3'],
shape: 'Rectangle',
color: '#1759B7',
},
{
id: '5',
name: 'Sign in',
label: ['Existing'],
parentId: ['3'],
shape: 'Rectangle',
color: '#1759B7',
},
{
id: '6',
name: 'Enter username \n and password',
label: ['', 'No'],
parentId: ['5', '7'],
shape: 'Data',
color: '#70AF16',
},
{
id: '7',
name: 'Authorized?',
parentId: ['6'],
shape: 'Decision',
color: '#2F95D8',
},
{
id: '8',
name: 'Login successful!!',
label: ['Yes'],
parentId: ['7'],
shape: 'Rectangle',
color: '#1759B7',
},
{
id: '9',
name: 'Enter first name \n and last name',
parentId: ['4'],
shape: 'Data',
color: '#70AF16',
},
{
id: '10',
name: 'Enter username \n and password',
label: ['', 'Yes'],
parentId: ['9', '11'],
shape: 'Data',
color: '#70AF16',
},
{
id: '11',
name: 'Username \n already \n exists?',
parentId: ['10'],
shape: 'Decision',
color: '#2F95D8',
},
{
id: '12',
name: 'Registration Successful!!',
label: ['No'],
parentId: ['11'],
shape: 'Process',
color: '#1759B7',
},
{
id: '13',
name: 'Open inbox',
parentId: ['8', '12'],
shape: 'Process',
color: '#1759B7',
},
{
id: '14',
name: 'End',
parentId: ['13'],
shape: 'Terminator',
color: '#8E44CC',
},
];
```
The Parent-child relationships are essential for structuring the flowchart. Ensure each node correctly references its parent using the **parentId** field to maintain the logical flow.
### Step 2: Binding the data source to the diagram
Once the data source is ready, bind it to the React Diagram component using [DataSourceSettings](https://ej2.syncfusion.com/react/documentation/api/diagram/dataSourceModel/)
. This will automatically map the nodes to the diagram and establish connections based on parent-child relationships.
Define the diagram control and bind the **dataSourceSettings** as follows.
```
(diagramInstance = diagram)}
width={'100%'}
height={'750px'}
dataSourceSettings={{
id: 'id',
parentId: 'parentId',
dataSource: new DataManager(data),
}}
>
```
### Step 3: Customize the layout
You can tailor the layout to suit your design preferences. To create a flowchart, set the [layoutType](https://ej2.syncfusion.com/react/documentation/api/diagram/layoutType/)
property to Flowchart. The layout class’s [horizontalSpacing](https://ej2.syncfusion.com/react/documentation/api/diagram/layoutModel/#horizontalspacing)
and [verticalSpacing](https://ej2.syncfusion.com/react/documentation/api/diagram/layoutModel/#verticalspacing)
properties can control the spacing between nodes.
Use the [margin](https://ej2.syncfusion.com/react/documentation/api/diagram/layoutModel/#margin)
property to add padding around the layout. These settings can also be bound to the user interface, enabling real-time updates for a more dynamic and flexible layout.
Refer to the following code example.
```
(diagramInstance = diagram)}
width={'100%'}
height={'750px'}
layout={{
type: 'Flowchart',
verticalSpacing: 50,
horizontalSpacing: 50,
margin:{left:10,right:10,top:10,bottom:10}
}}>
```
Once this code is executed, the flowchart will be automatically arranged, as shown in the following image.
Automating flowchart creation using the React Diagram
## Flowchart orientation customization
The Syncfusion React Diagram library allows for easy customization of the flowchart’s orientation. Depending on your layout requirements, you can set the flow direction to vertical (TopToBottom**)** or horizontal (LeftToRight**)**.
You can manage this flexibility through the [orientation](https://ej2.syncfusion.com/react/documentation/api/diagram/layoutOrientation/)
property of the [layout](https://ej2.syncfusion.com/react/documentation/api/diagram/layoutModel/)
class. By default, the flow direction is vertical, but you can easily change it to horizontal using the following code example.
```
layout={{
type: 'Flowchart',
orientation: 'TopToBottom',
}}
```
Refer to the following image.[https://www.syncfusion.com/blogs/wp-content/uploads/2024/10/Syncfusion-React-Diagram-library-with-Flowchart-orientation-customization.png](https://www.syncfusion.com/blogs/wp-content/uploads/2024/10/Syncfusion-React-Diagram-library-with-Flowchart-orientation-customization.png)
Flowchart orientation customization in React Diagram
## Customize the decision symbol
In flowcharts, decision symbols represent branching points where a choice is made between two paths. By default, the flowchart engine automatically determines the direction of these branches. However, with the Syncfusion React Diagram component, you can customize the direction of both the **Yes** and ** No** branches to suit your needs.
You can utilize the [yesBranchDirection](https://ej2.syncfusion.com/react/documentation/api/diagram/flowchartLayoutSettingsModel/#yesbranchdirection)
and [noBranchDirection](https://ej2.syncfusion.com/react/documentation/api/diagram/flowchartLayoutSettingsModel/#nobranchdirection)
properties of the [flowchartLayoutSettings](https://ej2.syncfusion.com/react/documentation/api/diagram/flowchartLayoutSettingsModel/)
to control the path direction for each branch.
The following code example demonstrates how to customize the Yes branch to follow the flow direction while the No branch diverges to the right.
```
layout={{
type: 'Flowchart',
orientation: 'TopToBottom',
}}
```
Refer to the following image.
Decision symbols customization in React Diagram
### Customize the Yes and No branch line text
Decision branches are typically labeled **Yes** and ** No**, but you can customize these labels to better fit your process flow better. Syncfusion’s React Diagram component allows you to define custom values for the ** Yes** and ** No** branches using the [yesBranchValues](https://ej2.syncfusion.com/react/documentation/api/diagram/flowchartLayoutSettingsModel/#yesbranchvalues)
and [noBranchValues](https://ej2.syncfusion.com/react/documentation/api/diagram/flowchartLayoutSettingsModel/#nobranchvalues)
properties of the [flowchartLayoutSettings](https://ej2.syncfusion.com/react/documentation/api/diagram/flowchartLayoutSettingsModel/)
.
By default, the [yesBranchValues](https://ej2.syncfusion.com/react/documentation/api/diagram/flowchartLayoutSettingsModel/#yesbranchvalues)
property contains **Yes** and ** True** string values, while the [noBranchValues](https://ej2.syncfusion.com/react/documentation/api/diagram/flowchartLayoutSettingsModel/#nobranchvalues)
property contains **No** and ** False**string values.
Refer to the following code example to demonstrate how to customize the connector text to say **Existing** for the ** Yes** branch and ** New** for the ** No** branch.
```
layout={{
type: 'Flowchart',
orientation: 'TopToBottom',
flowchartLayoutSettings: {
yesBranchValues: ['Existing', 'Yes'],
noBranchValues: ['New', 'No'],
},
}}
```
## Zoom and pan
Navigating and viewing large diagrams, such as complex flowcharts, on a small screen can be quite challenging. However, the zooming and panning features simplifies this process by allowing for detailed exploration of extensive diagrams.
To enable zooming and panning, set the [tool](https://ej2.syncfusion.com/react/documentation/api/diagram/diagramTools/)
property to ZoomPan. This allows users to easily zoom in and out using the **Ctrl + mouse wheel** and pan by clicking and dragging the diagram.
Refer to the following code example.
```
(diagramInstance = diagram)}
width={'100%'}
height={'750px'}
tool={DiagramTools.ZoomPan}
>
```
Then, use the **Ctrl + mouse wheel** operation to zoom in and out of the flowchart layout.
## Serialization and state persistence
Syncfusion React Diagram also provides serialization capabilities, enabling users to easily save the diagram’s state as a JSON string for later retrieval. This feature is particularly beneficial for users who need to revisit, edit, or share diagrams in the future.
A simple function call can save the diagram’s state, including nodes, connectors, and layout settings. The [saveDiagram()](https://ej2.syncfusion.com/react/documentation/api/diagram/#savediagram)
method serializes the diagram into a JSON string, which can be stored or passed to a server for future use. Later, the [loadDiagram()](https://ej2.syncfusion.com/react/documentation/api/diagram/#loaddiagram)
method restores the diagram from the saved data, allowing for seamless work continuation.
```
Function serialization(){
const data= diagramInstance.saveDiagram();
diagramInstance.loadDiagram(data);
}
```
## References
For more details, refer to our [demos](https://ej2.syncfusion.com/react/demos/#/fluent2/diagram/flowchart-layout)
, [documentation](https://ej2.syncfusion.com/documentation/diagram/flowchart-layout)
, and [GitHub demo](https://github.com/SyncfusionExamples/ej2-web-diagram-examples/tree/master/React/Flowchart-layout)
.
## Conclusion
Thanks for reading! In this blog, we have seen how to create and customize flowcharts from data without specifying coordinates using the [Syncfusion React Diagram component](https://www.syncfusion.com/react-components/react-diagram)
as part of the [2024 Volume 3](https://www.syncfusion.com/forums/194459/essential-studio-2024-volume-3-main-release-v27-1-48-is-available-for-download)
release. You can also use the library to create an interactive flowchart maker application. More built-in automatic layouts, such as hierarchical and radial tree, are also available in the Diagram control.
To explore more in-depth features, refer to our help documentation on [automatic layouts](https://ej2.syncfusion.com/react/documentation/diagram/automatic-layout)
. Also, check out the other new updates in this 2024 volume 3 release through our [Release Notes](https://ej2.syncfusion.com/react/documentation/release-notes/27.1.48?type=all#diagram)
and [What’s New](https://www.syncfusion.com/products/whatsnew)
pages.
Try out these features and share your feedback as comments on this blog. You can also reach us through our [support forums](https://www.syncfusion.com/forums)
, [support portal](https://support.syncfusion.com/)
, or [feedback portal](https://www.syncfusion.com/feedback/)
. We are always happy to assist you!
## Related Blogs
[Easily Create UML Activity Diagrams with React Diagram Library](https://www.syncfusion.com/blogs/post/uml-activity-diagram-in-react-diagram)
[Create AI-Assisted Mind Maps Using OpenAI and React Diagram Library](https://www.syncfusion.com/blogs/post/ai-assisted-mind-map-in-react-diagram)
[Build AI-Powered Text-to-Flowchart Converter Using OpenAI and React Diagram Library](https://www.syncfusion.com/blogs/post/react-text-to-flowchart-converter)
[Build Interactive UML Class Diagrams in React](https://www.syncfusion.com/blogs/post/create-uml-class-diagrams-in-react)