---
title: "API Improvements in WinUI 3 Charts: 2021 Volume 2"
published_at: "2021-08-17T11:00:31+00:00"
modified_at: "2025-03-24T07:35:29+00:00"
url: "https://www.syncfusion.com/blogs/post/api-improvements-in-winui-3-charts-2021-volume-2"
excerpt: "The Syncfusion WinUI 3 Charts control was designed to visually represent a huge amount of data in an elegant way. Its feature set includes data binding, multiple axes, legends, animations, data labels, trackballs, tooltip, gradient, and zooming. In this blog..."
taxonomy_category:
- "Chart"
- "Desktop"
- "What's new"
- "WinUI"
taxonomy_post_tag:
- "API"
- "Charts"
- "Data Visualization"
- "desktop"
- "performance"
- "productivity"
- "UI"
- "What's New"
- "WinUI"
---
# API Improvements in WinUI 3 Charts: 2021 Volume 2
[Karthikeyan V](https://www.syncfusion.com/blogs/author/karthikeyanv)
The Syncfusion [WinUI 3 Charts control](https://www.syncfusion.com/winui-controls/charts)
was designed to visually represent a huge amount of data in an elegant way. Its feature set includes data binding, multiple axes, legends, animations, data labels, trackballs, tooltip, gradient, and zooming. In this blog post, we are going to look at the various API changes in our WinUI Charts in the [2021 Volume 2](https://www.syncfusion.com/forums/166800/essential-studio-2021-volume-2-main-release-v19-2-0-44-is-available-for-download)
release. Most importantly, the SfChart control has been deprecated in favor of the following five new controls:
- [SfCartesianChart](#cartesian-charts)
- [SfCircularChart](#circular-chart)
- [SfPolarChart](#polar-chart)
- [SfPyramidChart](#pyramid-chart)
- [SfFunnelChart](#funnel-chart)
Now, let’s look at them and code examples for them in the new API structure.
## Cartesian charts
The WinUI [Cartesian chart](https://help.syncfusion.com/winui/cartesian-charts/getting-started)
is one of the basic chart categories. It supports more than 15 chart types such as line, spline, column, bar, area, scatter, and bubble.
For more details about the WinUI Cartesian chart, refer to the [demos on GitHub](https://github.com/syncfusion/winui-demos/tree/master/chart/Views/Basic%20Charts)
and [API documentation](https://help.syncfusion.com/cr/WinUI/Syncfusion.UI.Xaml.Charts.SfCartesianChart.html)
.
The following code example shows how to create the WinUI column chart.
```
```
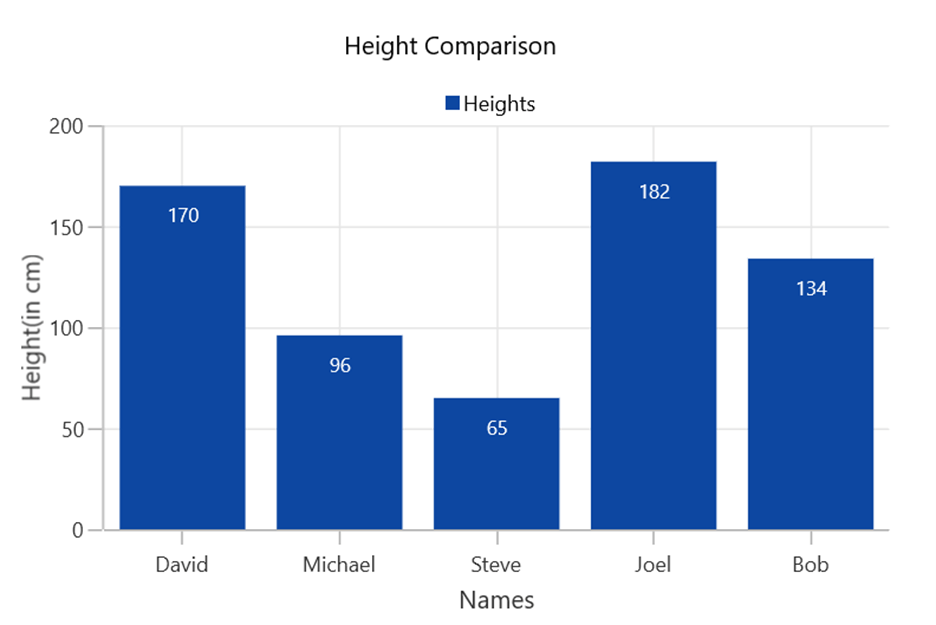
WinUI Cartesian (Column) Chart
## Circular chart
The WinUI [Circular chart](https://help.syncfusion.com/winui/circular-charts/getting-started)
(pie, doughnut, multiple pie) is user-friendly and gives greater UI visualization of data with proportions and percentages of different categories.
For more details about the WinUI Circular charts, refer to the [demos on GitHub](https://github.com/syncfusion/winui-demos/tree/master/chart/Views/Circular%20Charts)
and [API documentation](https://help.syncfusion.com/cr/WinUI/Syncfusion.UI.Xaml.Charts.SfCircularChart.html?tabs=tabid-1)
.
The following code example shows how to create the WinUI pie chart.
```
```

WinUI Circular (Pie) Chart
## Polar chart
The WinUI [Polar chart](https://help.syncfusion.com/winui/polar-chart/getting-started)
is used to visualize data in terms of values and angles. It visually compares several quantitative or qualitative aspects of a situation. It is a variant of the radar chart (spider chart).
For more details about the WinUI Polar chart, refer to the [demos on GitHub](https://github.com/syncfusion/winui-demos/tree/master/chart/Views/Polar%20And%20Radar%20Charts)
and [API documentation](https://help.syncfusion.com/cr/WinUI/Syncfusion.UI.Xaml.Charts.SfPolarChart.html)
.
The following code example shows how to use the WinUI Polar chart to design a radar chart by specifying the GridLineType property as Polygon.
```
```
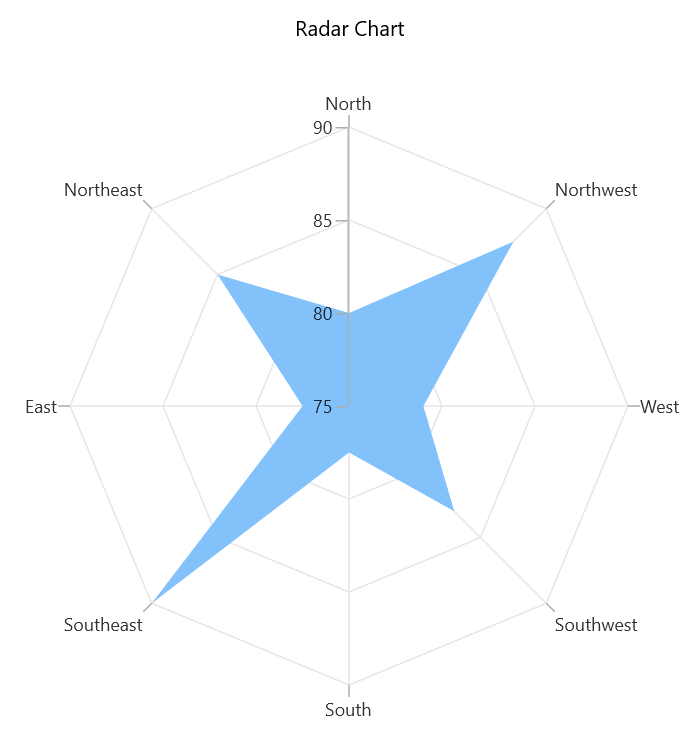
Designing a Radar Chart Using WinUI Polar Chart
## Pyramid chart
The WinUI [Pyramid chart](https://help.syncfusion.com/winui/pyramid-chart/getting-started)
is used to visually represent hierarchies in a pyramid-like structure that shows the proportions of a total.
For more details about the WinUI Pyramid chart, refer to the [demos on GitHub](https://github.com/syncfusion/winui-demos/tree/master/chart/Views/Funnel%20And%20Pyramid%20Charts)
and [API documentation](https://help.syncfusion.com/cr/WinUI/Syncfusion.UI.Xaml.Charts.SfPyramidChart.html)
.
The following code example shows how to create the WinUI Pyramid chart.
```
```
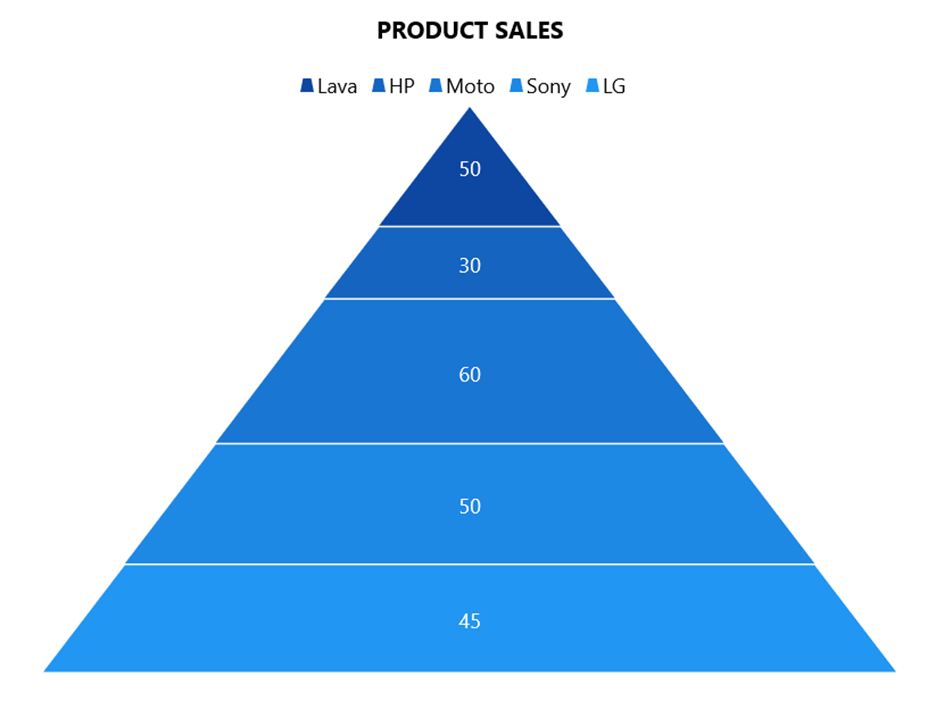
WinUI Pyramid Chart
## Funnel chart
The WinUI [Funnel chart](https://help.syncfusion.com/winui/funnel-chart/getting-started)
is used to plot streamlined data to show various stages in a process.
For more details about the WinUI Funnel chart, refer to the [demos on GitHub](https://github.com/syncfusion/winui-demos/tree/master/chart/Views/Funnel%20And%20Pyramid%20Charts)
and [API documentation](https://help.syncfusion.com/cr/WinUI/Syncfusion.UI.Xaml.Charts.SfFunnelChart.html)
.
The following code example shows how to create the WinUI Funnel Chart.
```
```
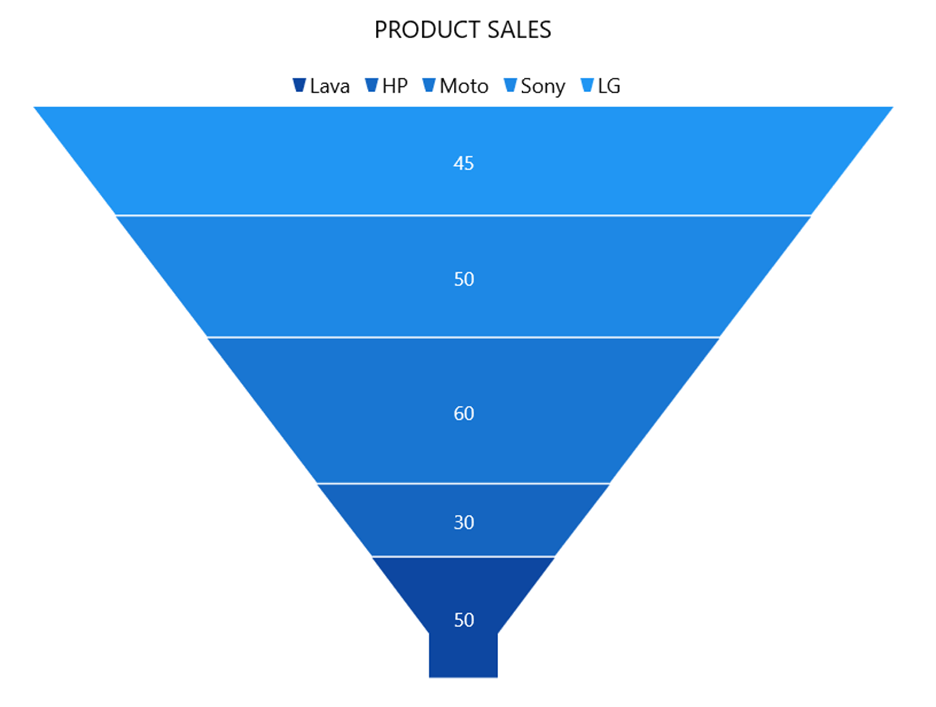
WinUI Funnel Chart
**Note:** Also, refer to the [WinUI Charts feature tour page](https://www.syncfusion.com/winui-controls/charts/2d-chart-types)
, and [demos on the App Center](https://install.appcenter.ms/orgs/syncfusion-demos/apps/winui-demos/distribution_groups/release)
.
## API breaking changes
Let’s discuss the API-breaking changes in the WinUI Charts control that rolled out in the 2021 Volume 2 release.
### Classes
| Previous Class | Current Class |
| --- | --- |
| SfChart | SfCartesianChartSfCircularChartSfPolarChartSfPyramidChartSfFunnelChart |
| ChartDataMarker | CartesianDataLabelSettingsCircularDataLabelSettingsPyramidDataLabelSettingsFunnelDataLabelSettingsPolarDataLabelSettings |
| ChartDataMarkerLabel | ChartDataLabel |
### Property
| Class | Previous API | Current API |
| --- | --- | --- |
| ChartSeries | DataMarker | DataLabelSettings |
| SfChart | AreaBackgroundAreaBorderThicknessAreaBorderBrushSideBySideSeriesPlacement | PlotAreaBackgroundPlotAreaBorderThicknessPlotAreaBorderBrushEnableSideBySideSeriesPlacement |
| ChartSelectionBehavior | SelectionCursorSelectionType | CursorType |
| ChartSelectionBehavior | The following properties have been removed.EnableSegmentSelectionEnableSeriesSelectionSelectionMode | The following new enum SelectionType values have been added.PointSeriesMultiPointMultiSeriesUG link – Selection |
| ChartDataMarker | ShowLabel | ShowDataLabels ( Moved from ChartDataMarker to ChartSeriesBase.) |
**Note:** For more details, refer to the [API Breaking Changes in the 2021 Volume 2: WinUI Charts documentation](https://help.syncfusion.com/winui/release-notes/v19.2.0.44?type=all#sfchart-preview)
.
## Conclusion
Thanks for reading! We have seen the API improvements and breaking changes in our Syncfusion [WinUI 3 Charts](https://www.syncfusion.com/winui-controls/charts)
control in the [2021 Volume 2](https://www.syncfusion.com/forums/166800/essential-studio-2021-volume-2-main-release-v19-2-0-44-is-available-for-download)
release. These updates are available in our [Release Notes](https://help.syncfusion.com/common/essential-studio/release-notes/v19.2.0.51)
and [What’s New](https://www.syncfusion.com/products/whatsnew)
pages, too. So, try out them and leave your feedback in the comments section of this blog post!
For existing customers, the newest version is available for download from the [License and Downloads](https://www.syncfusion.com/account/downloads)
page. If you are not yet a Syncfusion customer, you can try our 30-day [free trial](https://www.syncfusion.com/downloads)
to check out the available features. Also, you can try our samples on [GitHub](https://github.com/syncfusion)
.
You can also contact us through our [support forums](https://www.syncfusion.com/forums)
, [Direct-Trac](https://www.syncfusion.com/support/directtrac/incidents)
, or [feedback portal](https://www.syncfusion.com/feedback/winui)
. We are always happy to assist you!
## Related blogs
- [Syncfusion Defers UWP Support in WinUI 3 Suite](https://www.syncfusion.com/blogs/post/syncfusion-defers-uwp-support-in-winui-3-suite.aspx)
- [Introducing the New WinUI NumberBox Control](https://www.syncfusion.com/blogs/post/introducing-the-new-winui-numberbox-control.aspx)
- [Introducing Syncfusion Ribbon for WinUI](https://www.syncfusion.com/blogs/post/introducing-syncfusion-ribbon-for-winui.aspx)
- [What’s New in 2021 Volume 2: WinUI](https://www.syncfusion.com/blogs/post/whats-new-in-2021-volume-2-winui.aspx)