---
title: "Unveiling the New Angular 3D Circular Charts Component"
published_at: "2024-04-03T17:51:08+00:00"
modified_at: "2026-02-10T13:14:38+00:00"
url: "https://www.syncfusion.com/blogs/post/angular-3d-circular-charts"
excerpt: "This blog outlines the new Syncfusion Angular 3D Circular Charts component in the 2024 Volume 1 release and how to begin using it."
taxonomy_category:
- "Angular"
- "Chart"
- "Syncfusion"
- "Web"
taxonomy_post_tag:
- "Angular"
- "Charts"
- "Data Visualization"
- "Web"
- "What's New"
---
# Unveiling the New Angular 3D Circular Charts Component
[Veerakumar Narayanasamy](https://www.syncfusion.com/blogs/author/veerakumar-narayanasamy)
**TLDR:** Exploring the new Syncfusion Angular 3D Circular Charts component, visualizing data with its marvelous features and code examples.
We are thrilled to introduce the new [Angular 3D Circular Charts](https://www.syncfusion.com/angular-components/angular-3d-circular-chart)
component in the [Essential Studio® 2024 Volume 1](https://www.syncfusion.com/forums/187257/essential-studio-2024-volume-1-main-release-v25-1-35-is-available-for-download)
release. It is designed to revolutionize data presentation by injecting depth and clarity into your visualizations, taking information to a whole new dimension for enhanced engagement and understanding.
## Exploring the world of 3D Circular Charts
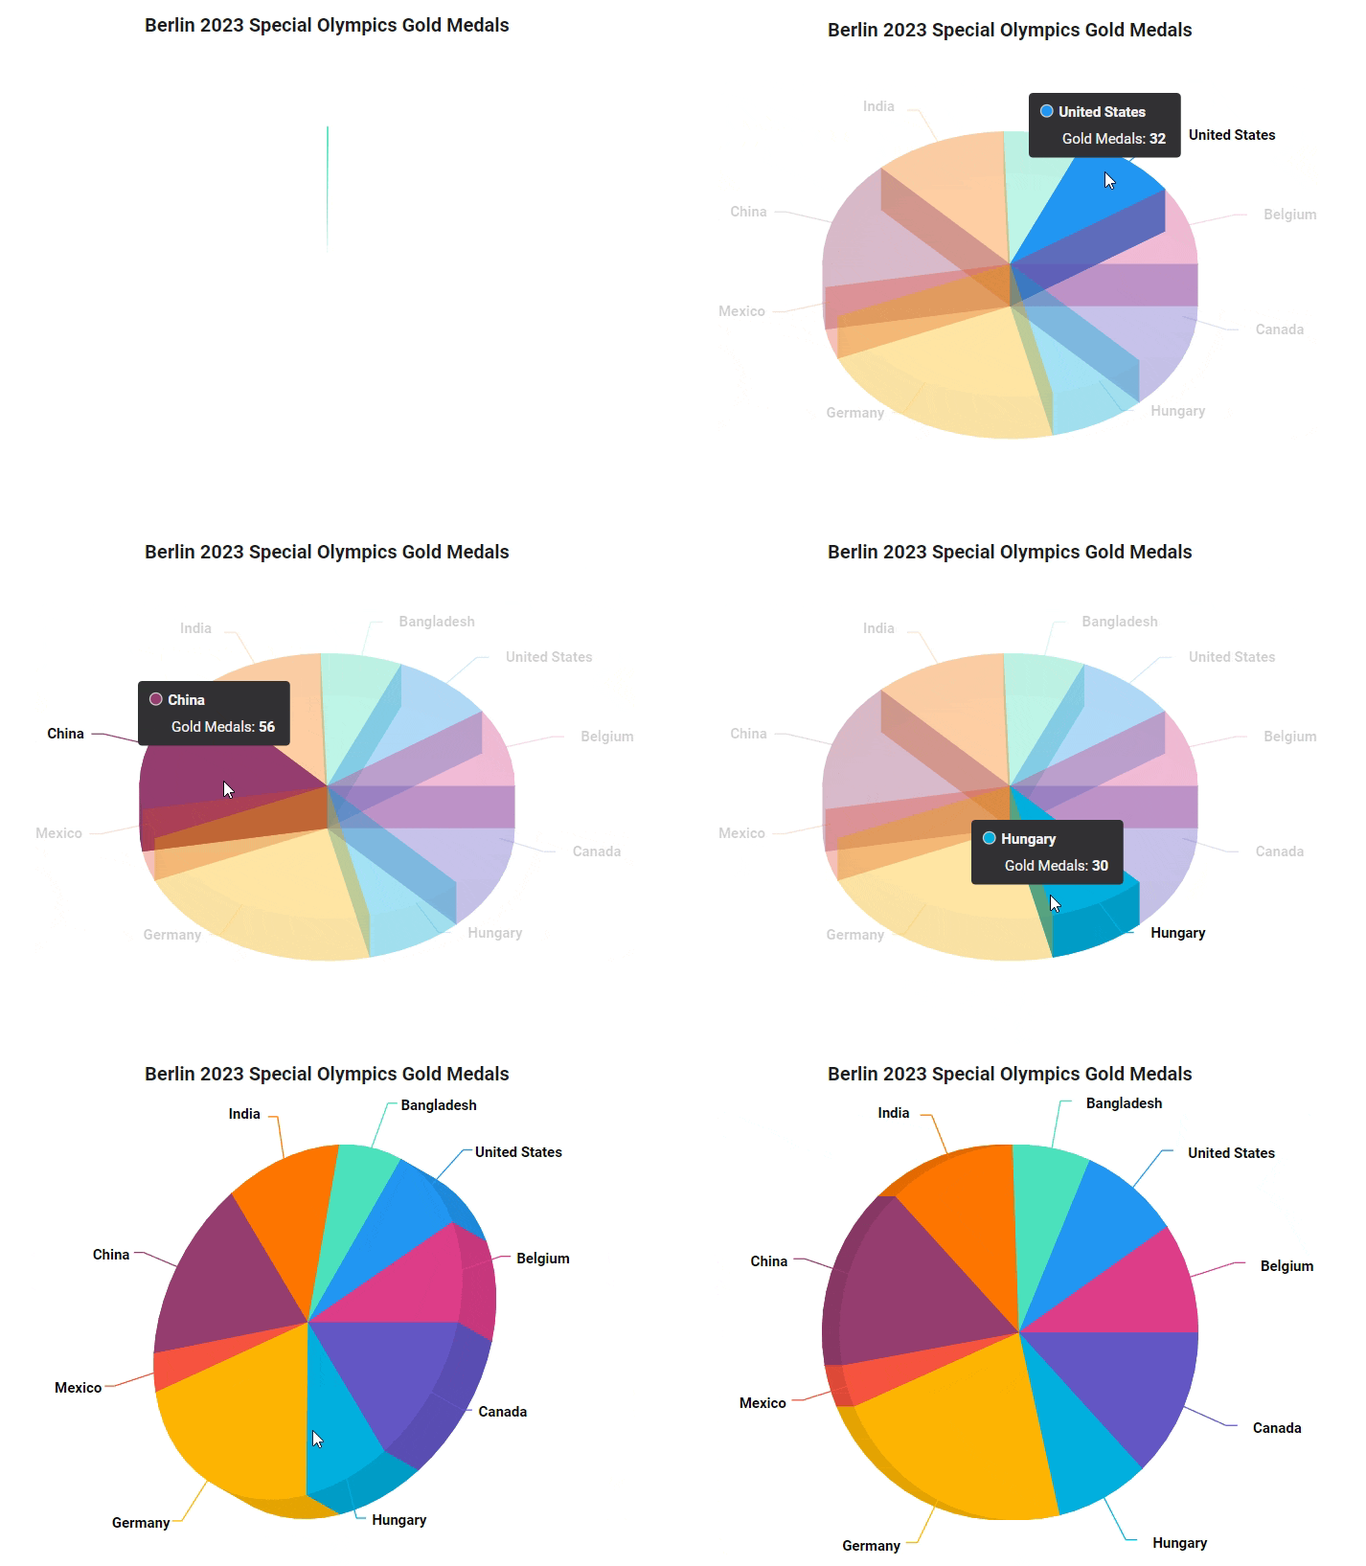
The Angular 3D Circular Charts component provides a graphical representation of data in three dimensions, with each slice’s size indicating its proportion relative to the entire dataset.
Unlike the traditional 2D charts, the 3D Circular Charts component adds depth to the visualization, allowing a better understanding of data patterns.
Angular 3D Circular Charts component
## Key features that define excellence
Let’s see the vivid features of the Angular 3D Circular Charts component:
### Chart types
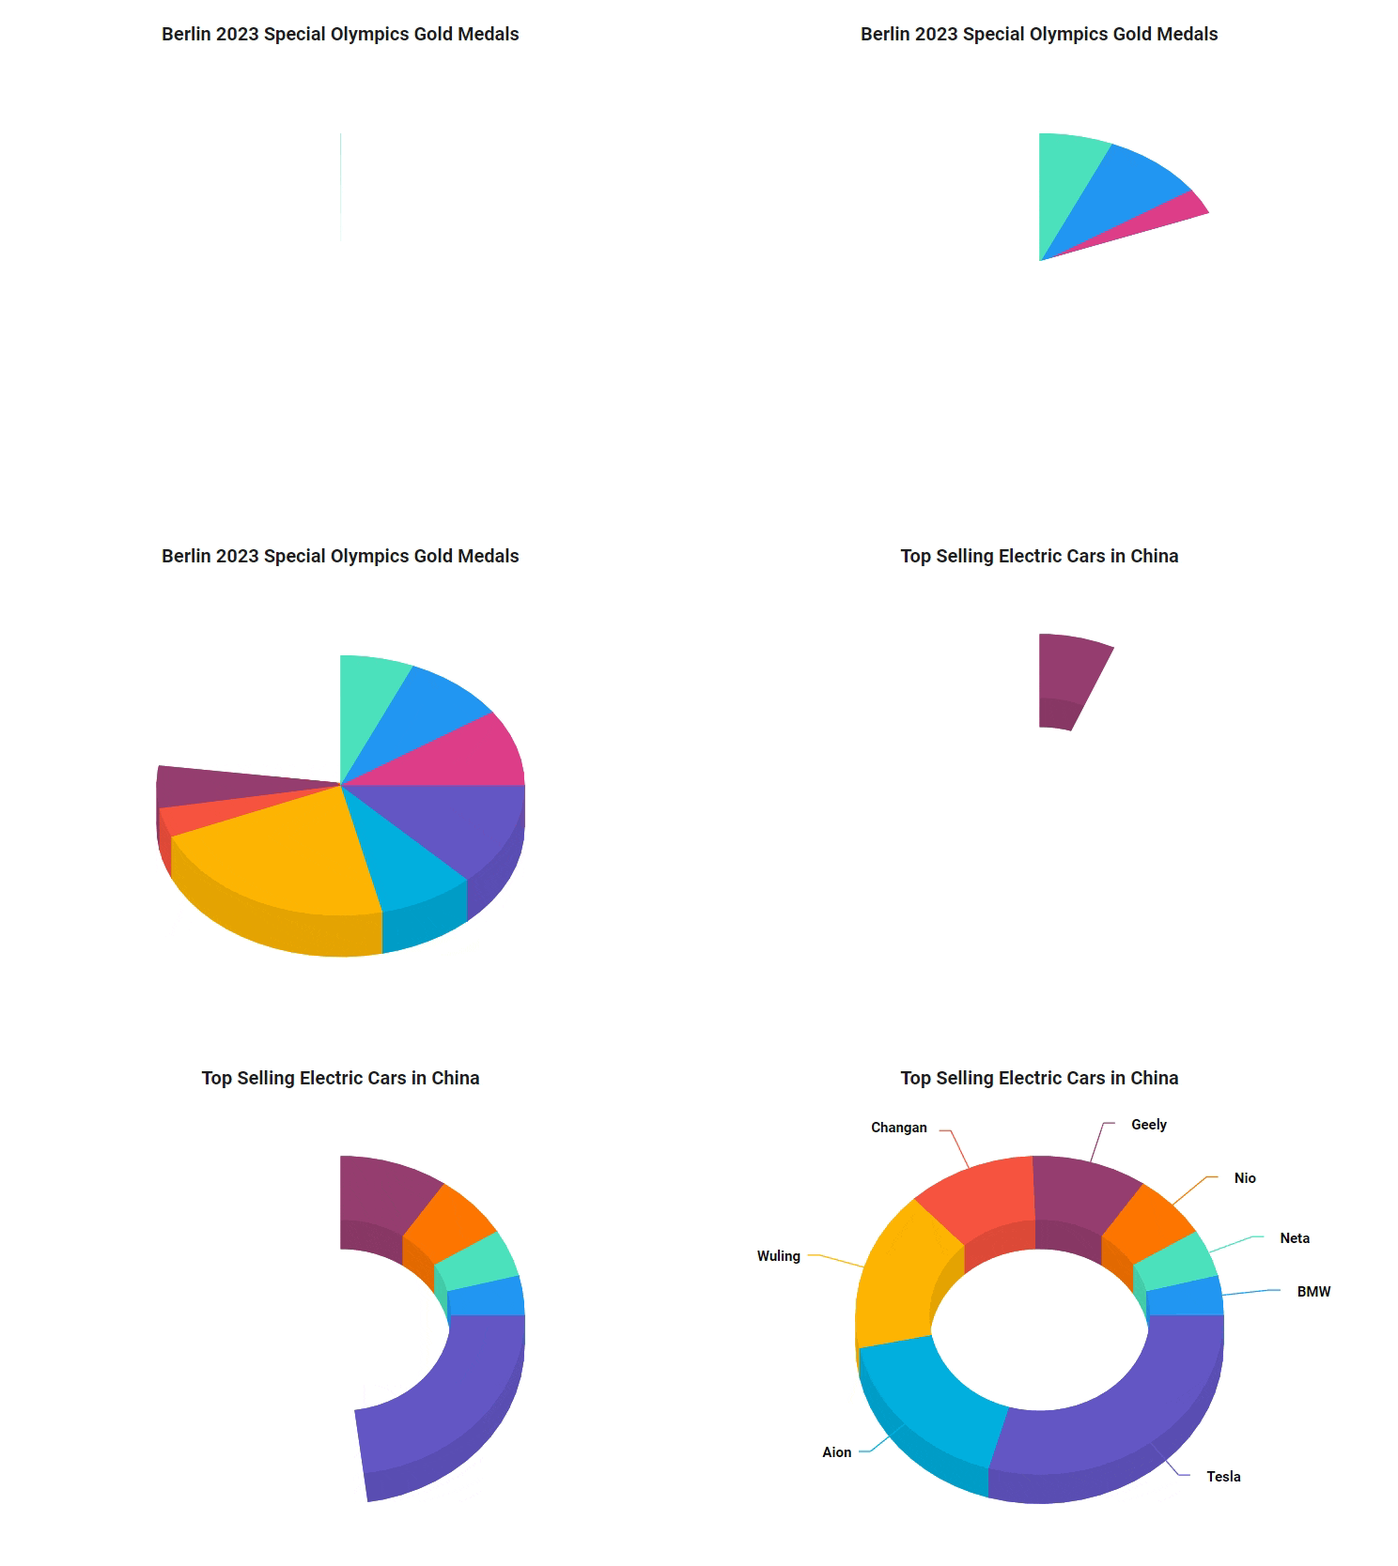
The Angular 3D Circular Charts component boasts two versatile chart types,
- **Pie**: A pie chart is a circular diagram representing the proportions of a whole by dividing it into slices.
- **Donut**: A donut is a circular chart akin to a pie chart but featuring a central void, representing data proportions and distributions.
Angular 3D Pie and Donut Circular Charts
### Data binding
You can effortlessly bind the 3D Circular Charts component with an array of JSON objects or a DataManager, supporting local and remote data binding methods. Not only can chart series be bound, but data labels and tooltips can also be seamlessly integrated with your data.
Binding data with the Angular 3D Circular Charts
### Data labels
Data labels represent textual or numeric information attached to individual data points. We can also enhance these labels with HTML elements such as images, DIV, and spans, creating informative and visually appealing data representations.
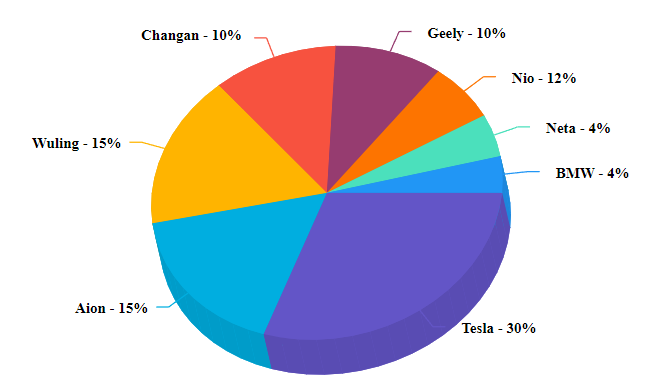
Data labels in Angular 3D Circular Charts
### Legends
Legends provide essential information about data categories in a chart. Labels and symbols aid viewers in identifying and differentiating between various data points within the chart.
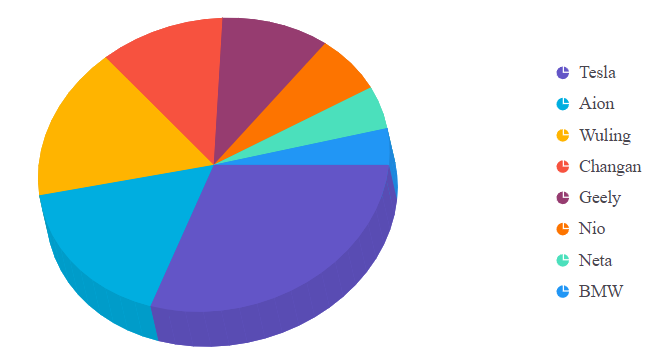
Legends in Angular 3D Circular Charts
### User interaction features
Elevate user experience with interactive features such as tooltips, highlight, and selection.
- **Tooltip**: A small, informative pop-up box offering additional context, details, or information when users hover over or click on chart data.
- **Highlight and selection**: Easily highlight and select data points for improved comprehension. Adding patterns and colors to selected data enhances the chart’s interactivity.
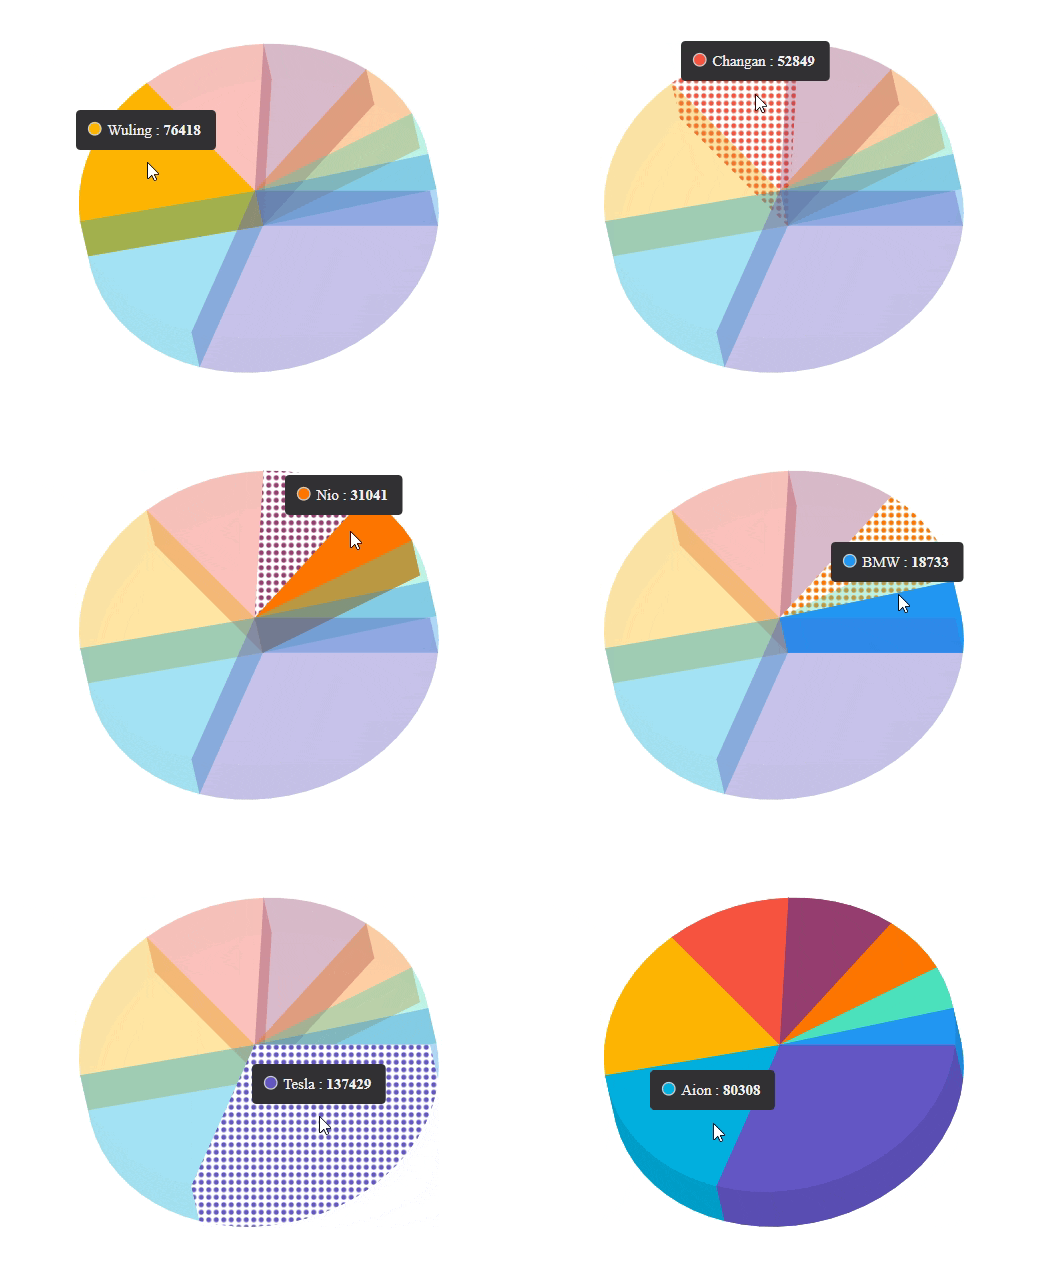
User interactive features in Angular 3D Circular Charts
### Rotation and tilt
**Rotation**: We can dynamically rotate the 3D Circular Charts component from 0 to 360 degrees around a fixed point in a three-dimensional space, clockwise or anti-clockwise.
**Tilt**: We can also alter the inclination angle of the chart to provide a unique and engaging perspective.
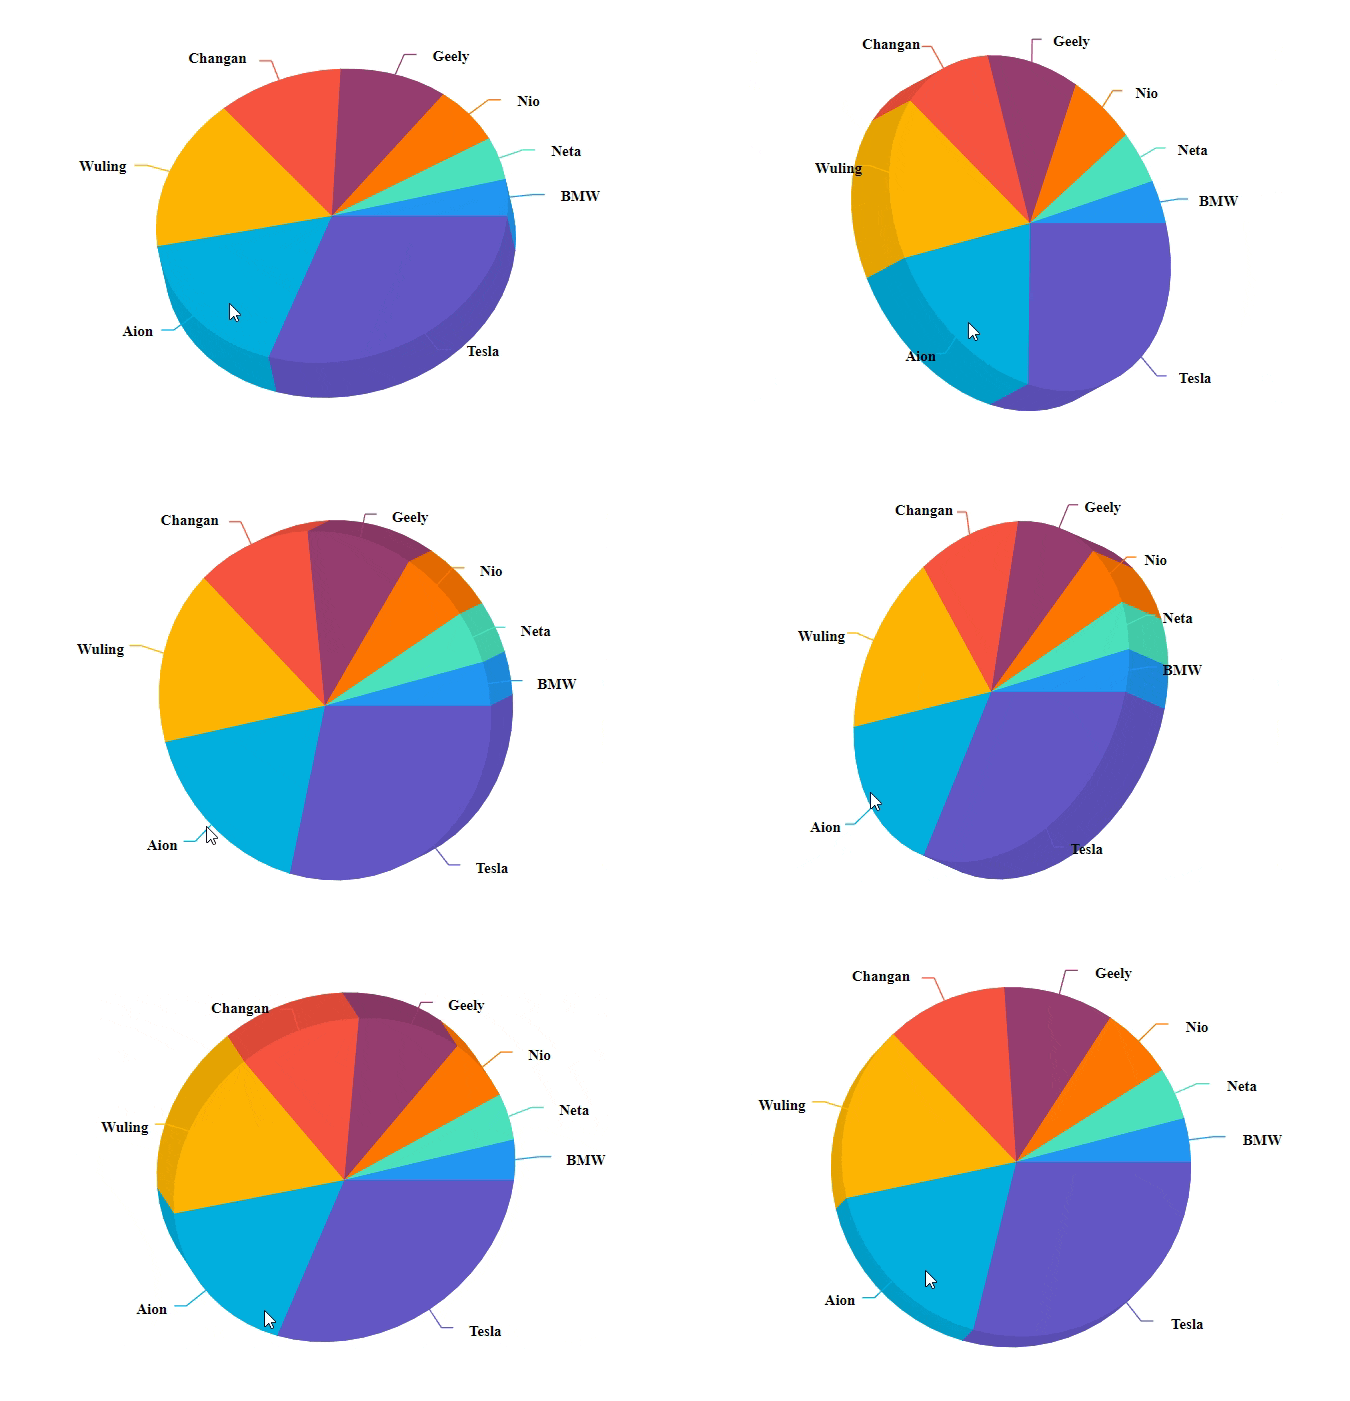
Rotation and tilt features in Angular 3D Circular Charts
## Getting started with the Angular 3D Circular Charts component
We’ve explored the marvelous features of the Angular 3D Circular Charts component. Let’s see how to integrate it into your Angular app.
- First, create an Angular app using the following command.``` ng new-my app cd my-app ```
- Now, install the Syncfusion Angular Charts NPM package using the following command.``` npm install @syncfusion/ej2-angular-charts –save ```
- Import the 3D Circular Charts module into the Angular app from the package **@syncfusion/ej2-angular-charts** in the ** app.module.ts** file.``` import { NgModule } from '@angular/core'; import { BrowserModule } from '@angular/platform-browser'; // Import the Chart Module for the Chart component. import { CircularChart3DModule } from '@syncfusion/ej2-angular-charts'; import { AppComponent } from './app.component'; @NgModule({ //Declaration of ChartModule into NgModule. imports: [ BrowserModule, CircularChart3DModule ], declarations: [ AppComponent ], bootstrap: [ AppComponent ] }) export class AppModule { } ```
- Modify the template in the **app.component.ts** file to render the 3D Circular Charts component.``` import { Component, ViewEncapsulation } from '@angular/core'; @Component({ selector: 'app-container', // Specifies the template string for the 3D Circular Charts component. template: ``, encapsulation: ViewEncapsulation.None }) export class AppComponent { } ```
- Use the app-container in the **html** file instead of the default one.``` ```
- Now, run the app using the following command.``` npm start ```
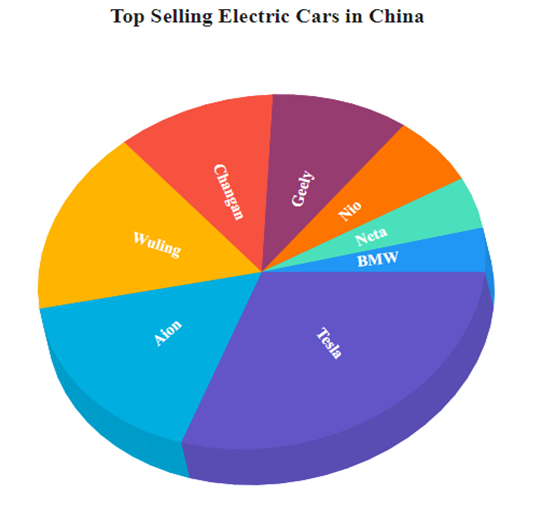
- Finally, let’s render a 3D Pie Circular Chart using the following code.**App.component.ts** ``` import { Component, OnInit } from '@angular/core'; @Component({ selector: 'app-container', template: ` ` }) export class AppComponent implements OnInit { public dataSource?: Object[]; public enableRotation?: boolean; public tooltip?: Object[]; ngOnInit(): void { this.dataSource = [ { x: 'Tesla', y: 137429 }, { x: 'Aion', y: 80308 }, { x: 'Wuling', y: 76418 }, { x: 'Changan', y: 52849 }, { x: 'Geely', y: 47234 }, { x: 'Nio', y: 31041 }, { x: 'Neta', y: 22449 }, { x: 'BMW', y: 18733 }]; this.enableRotation = true; this.tooltip = {enable: true}; } } ```
After executing the above code examples, we’ll get the output that resembles the following image.
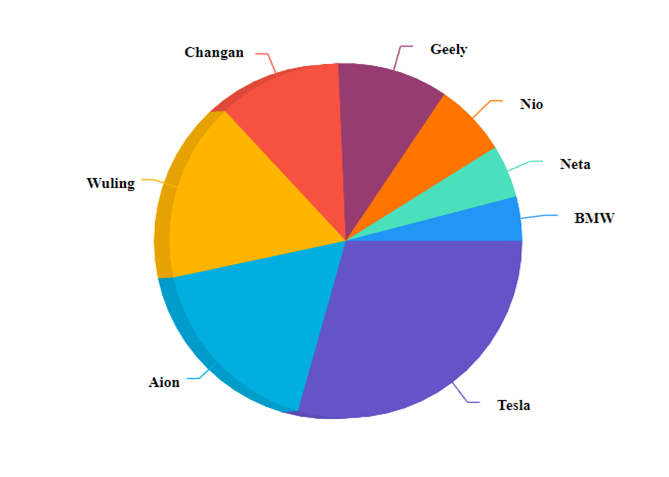
Integrating the 3D Circular Charts component in the Angular app
## References
For more details, refer to the [Angular 3D Circular Charts documentation](https://ej2.syncfusion.com/angular/documentation/circular-chart-3d/getting-started)
and [demos](https://ej2.syncfusion.com/angular/demos/#/material3/three-dimension-circular-chart/donut)
.
## Conclusion
Thanks for reading! We’ve explored the new [Angular 3D Circular Charts](https://www.syncfusion.com/angular-components/angular-3d-circular-chart)
component, a remarkable addition to our [2024 Volume 1](https://www.syncfusion.com/forums/187257/essential-studio-2024-volume-1-main-release-v25-1-35-is-available-for-download)
release. This powerful tool is designed to improve your data visualization experience, and we’re eager to hear your thoughts on it. Don’t hesitate to share your opinion in the comments section.
For a detailed overview of this release’s exciting updates, we invite you to visit our [Release Notes](https://ej2.syncfusion.com/angular/documentation/release-notes/25.1.35?type=all)
and [What’s New](https://www.syncfusion.com/products/whatsnew/angular)
pages. For our existing customers, the new version of Essential Studio® is available on the [License and Downloads](https://www.syncfusion.com/account/login)
page. If you’re new to Syncfusion, we offer a [30-day free trial](https://www.syncfusion.com/downloads)
so you can experience the vast array of features we provide. It’s a great opportunity to explore how our tools can enhance your development process.
If you have any questions, you can reach us through our [support forum](https://www.syncfusion.com/forums)
, [support portal](https://support.syncfusion.com/)
, or [feedback portal](https://www.syncfusion.com/feedback/)
. Your satisfaction is our top priority, and we’re always happy to assist you in any way we can.
## Related blogs
- [What’s New in Angular 17 and for Syncfusion Angular Components](https://www.syncfusion.com/blogs/post/whats-new-angular-17-syncfusion)
- [Unveiling the New Angular 3D Chart: A Step Forward in Data Visualization](https://www.syncfusion.com/blogs/post/angular-3d-chart)
- [Easily Create Interactive Digital Logic Circuits in Angular](https://www.syncfusion.com/blogs/post/digital-logic-circuits-angular)
- [Maximizing Angular Charts Performance with Lazy Loading](https://www.syncfusion.com/blogs/post/lazy-loading-angular-charts)