---
title: "Seamlessly Add Blazor Native UI Components in Hybrid Apps"
published_at: "2024-05-30T14:16:46+00:00"
modified_at: "2026-01-09T08:38:52+00:00"
url: "https://www.syncfusion.com/blogs/post/add-blazor-component-in-hybrid-apps"
excerpt: "This blog explains how to integrate the Syncfusion Blazor Charts component into a Grid layout within a .NET MAUI Blazor hybrid app."
taxonomy_category:
- ".NET MAUI"
- "Blazor"
- "Chart"
- "Desktop"
- "Development"
- "UI"
- "Web"
taxonomy_post_tag:
- ".NET MAUI"
- "Blazor"
- "Chart"
- "Cross-Platform"
- "hybrid app"
- "productivity"
---
# Seamlessly Add Blazor Native UI Components in Hybrid Apps
[Mahesh Palanisamy](https://www.syncfusion.com/blogs/author/mahesh-palanisamy)

**TL;DR:** Want to deploy your Blazor apps on multiple platforms? You can do it with .NET MAUI Blazor hybrid apps. This blog shows an example of integrating Syncfusion Blazor Charts into a .NET MAUI Blazor hybrid app. It covers creating a new project in Visual Studio, setting up a Grid layout, embedding various chart types and running the app on Android, iOS, macOS, and Windows with a single codebase.
Step into the dynamic world of hybrid apps, where a singular codebase unlocks benefits like accelerated speed, streamlined development, and cost-effective maintenance across platforms. This blog explains how to seamlessly integrate the Syncfusion [Blazor Charts](https://www.syncfusion.com/blazor-components/blazor-charts)
into the MAUI Grid layout within your .NET MAUI Blazor hybrid app.
Syncfusion Blazor Charts component includes functionality for plotting more than 50 chart types. Each chart type is easily configured with built-in support for creating stunning visual effects.
By following the detailed steps outlined in this blog, you will harness the power of hybrid app development and enhance your app’s visual appeal and functionality.
Let’s embark on this enriching exploration together!
## What is the .NET **MAUI** Blazor hybrid app?
A [.NET MAUI Blazor hybrid app](https://learn.microsoft.com/en-us/aspnet/core/blazor/hybrid/?view=aspnetcore-8.0#blazor-hybrid-apps-with-net-maui)
seamlessly combines the power of .NET MAUI with Blazor web apps by hosting them within a .NET MAUI app through the [BlazorWebView](https://learn.microsoft.com/en-us/dotnet/maui/user-interface/controls/blazorwebview?view=net-maui-8.0)
control. This integration allows Blazor web apps to leverage platform features and UI controls effortlessly. The flexibility extends to adding **BlazorWebView** to any page within the .NET MAUI app, directing it to the root of the Blazor app.
By enabling Blazor components to run natively in the .NET process and render web UI to an embedded web view control, the .NET MAUI Blazor apps offer a unified solution across all platforms supported by .NET MAUI.
## Prerequisites
- [.NET SDK 8.0 (Latest .NET SDK 8.0.100 or above)](https://dotnet.microsoft.com/en-us/download/visual-studio-sdks)
- The latest preview of [Visual Studio 2022](https://visualstudio.microsoft.com/vs/) (17.8 or above), equipped with the required workloads:
1.
1. Mobile development with .NET.
2. ASP.NET and web development.
## Create a new .NET MAUI Blazor hybrid app in Visual Studio
Follow these steps to create a new .NET MAUI Blazor hybrid app in Visual Studio:
**Step 1:** Launch Visual Studio 2022 and click ** Create a new project** in the start window.
**Step 2:** Choose the **.NET MAUI Blazor Hybrid App** template and proceed to the next step.
**Step 3:** In the ** Configure your new project** window, name your project, select a location, and click ** Create**.
**Step 4:** Wait for the project and its dependencies to be created. You’ll then witness a project structure ready for exploration.
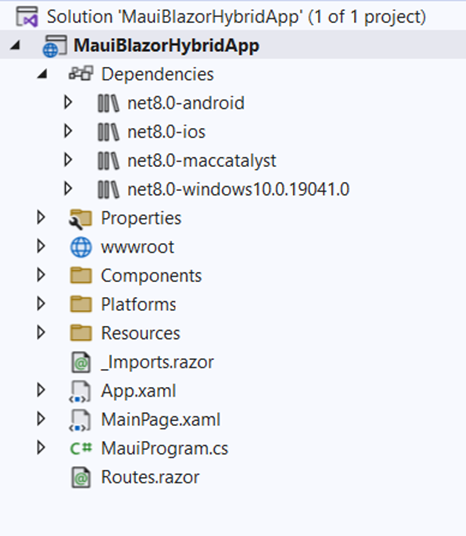
Create a new .NET MAUI Blazor hybrid app
## Add BlazorWebView control inside the MAUI Grid layout in the .NET MAUI Blazor hybrid app
We’ve created a cross-platform .NET MAUI Blazor hybrid app which can be deployed to Android, iOS, macOS, and Windows.
Now, in the **MainPage.xaml**, create a Grid with two rows and two columns. Also, position the ** BlazorWebView** control in specific Grid cells. Each Syncfusion Blazor Charts component is rendered as a ** BlazorWebView** control. Here, we’ll render four different types of Blazor Charts, each in different razor pages to showcase the charts in a dashboard-like layout using MAUI Grid layout.
**MainPage.xaml**
```
```
## Integrate Syncfusion Blazor Charts in .NET MAUI Blazor hybrid app
Follow these steps to add the Syncfusion Blazor Charts component in your .NET MAUI Blazor hybrid app:
### Step 1: Install the NuGet packages
1. Syncfusion Blazor components are available in the [NuGet Gallery](https://www.nuget.org/packages?q=syncfusion.blazor) . To use Syncfusion Blazor components, we need to add a reference to the corresponding NuGet. Refer to the [NuGet packages documentation](https://blazor.syncfusion.com/documentation/nuget-packages) for a list of available NuGet packages and the [benefits of using individual NuGet packages](https://blazor.syncfusion.com/documentation/nuget-packages#benefits-of-using-individual-nuget-packages) .
2. To add the Blazor Charts component to the app, open the **NuGet package manager** in ** Visual Studio** (** Tools -> NuGet Package Manager -> Manage NuGet Packages for Solution**), search for ** Syncfusion.Blazor.Charts**, and then install it.
### Step 2: Register the Syncfusion Blazor service
Then, we need to register the Syncfusion Blazor service in our .NET MAUI Blazor hybrid app by following these steps:
1. Open the **~/Imports.razor** file and add the ** Syncfusion.**** Blazor** namespace.``` ... ... @using Syncfusion.Blazor ```
2. Now, register the Syncfusion Blazor service in the **MauiProgram.cs** file.``` using Microsoft.Extensions.Logging; using Syncfusion.Blazor; namespace MauiBlazorHybridApp { public static class MauiProgram { public static MauiApp CreateMauiApp() { var builder = MauiApp.CreateBuilder(); ... ... builder.Services.AddMauiBlazorWebView(); builder.Services.AddSyncfusionBlazor(); ... return builder.Build(); } } } ```
### Step 3: Enhance styling and add script references
To refine the styling and incorporate script references for the Syncfusion Blazor Charts component, follow these steps:
#### Add stylesheet for themes
Explore different themes available to your app using the [Blazor Themes documentation](https://blazor.syncfusion.com/documentation/appearance/themes)
and achieve the desired appearance for the Syncfusion Blazor Charts component. For this guide, the theme is referenced using [Static Web Assets](https://blazor.syncfusion.com/documentation/appearance/themes#static-web-assets)
.
To add a theme to your app:
1. Open the NuGet package manager in Visual Studio (**Tools -> NuGet Package Manager -> Manage NuGet Packages for Solution**).
2. Search for [Syncfusion.Blazor.Themes](https://www.nuget.org/packages/Syncfusion.Blazor.Themes/) and install it.
3. Then, refer to the theme stylesheet inside the <**head>** element of the ** wwwroot/index.html** file.``` ```
#### Add script reference
Learn how to add script references to the Blazor app by referring to [Adding script reference](https://blazor.syncfusion.com/documentation/common/adding-script-references)
documentation. Here, the scripts are referred to [Static Web Assets](https://sfblazor.azurewebsites.net/staging/documentation/common/adding-script-references#static-web-assets)
externally, inside the **** element of the ** wwwroot/index.html** file.
```
```
## Initializing Syncfusion Blazor Charts
Follow these steps to integrate different chart components in our .NET MAUI Blazor hybrid app:
### Integrating Blazor Column Chart
1. Open the **~/Components/Pages/ColumnChart.razor** page and initialize the [Column Chart](https://blazor.syncfusion.com/documentation/chart/chart-types/column) component. Ensure the ** ColumnChart** component is appropriately set up to showcase the desired data.``` @using Syncfusion.Blazor.Charts @code { // Code-behind... } ```
2. Add the **ColumnChart** component in the ** MainPage.xaml** page within the MAUI Grid layout. Refer to the following code examples.** XAML** ``` ``` ** C#** ``` @using Syncfusion.Blazor.Charts @code { SfChart chart1; string Width = "100%"; string Height = "100%"; public List ColumnChartDataCollection { get; set; } = new List { new ChartData { Period = "2017", Percentage = 60, TextMapping = "60%" }, new ChartData { Period = "2018", Percentage = 56, TextMapping = "56%"}, new ChartData { Period = "2019", Percentage = 71, TextMapping = "71%" }, new ChartData { Period = "2020", Percentage = 85, TextMapping = "85%" }, new ChartData { Period = "2021", Percentage = 73, TextMapping = "73%" }, }; public List ColumnChartData { get; set; } = new List { new ChartData { Period = "2017", Percentage = 40, TextMapping = "40%" }, new ChartData { Period = "2018", Percentage = 44, TextMapping = "44%"}, new ChartData { Period = "2019", Percentage = 29, TextMapping = "29%" }, new ChartData { Period = "2020", Percentage = 15, TextMapping = "15%" }, new ChartData { Period = "2021", Percentage = 27, TextMapping = "27%" }, }; public class ChartData { public string Period { get; set; } public string Product { get; set; } public double Percentage { get; set; } public string TextMapping { get; set; } public string AnnotationX { get; set; } public string AnnotationY { get; set; } public string PointColor { get; set; } } } ```
### Integrating Blazor Accumulation Chart
1. Open the **~/Components/Pages/ AccumulationChart.razor** page and initialize the [Accumulation Chart](https://blazor.syncfusion.com/documentation/accumulation-chart/chart-types/pie-doughnut) component.
2. Add the **AccumulationChart** component within the ** MAUI Grid layout** on the ** MainPage.xaml** page as shown below.** XAML** ``` ``` ** C#** ``` @using Syncfusion.Blazor.Charts @code { string Width = "100%"; string Height = "100%"; string Radius = "80%"; string Color; private string[] palettes = new string[] { "#61EFCD", "#CDDE1F", "#FEC200", "#CA765A", "#2485FA", "#F57D7D", "#C152D2", "#8854D9", "#3D4EB8", "#00BCD7","#4472c4", "#ed7d31", "#ffc000", "#70ad47", "#5b9bd5", "#c1c1c1", "#6f6fe2", "#e269ae", "#9e480e", "#997300" }; public List PieChartDataCollection { get; set; } = new List { new ChartData { Product = "TV : 30 (12%)", Percentage = 12, TextMapping = "TV, 30 12%"}, new ChartData { Product = "PC : 20 (8%)", Percentage = 8, TextMapping = "PC, 20 8%"}, new ChartData { Product = "Laptop : 40 (16%)", Percentage = 16, TextMapping = "Laptop, 40 16%"}, new ChartData { Product = "Mobile : 90 (36%)", Percentage = 36, TextMapping = "Mobile, 90 36%"}, new ChartData { Product = "Camera : 27 (11%)", Percentage = 11, TextMapping = "Camera, 27 11%"} }; public class ChartData { public string Period { get; set; } public string Product { get; set; } public double Percentage { get; set; } public string TextMapping { get; set; } public string AnnotationX { get; set; } public string AnnotationY { get; set; } public string PointColor { get; set; } } } ```
### Integrating Blazor Spline Chart
1. Initialize the [Spline Chart](https://blazor.syncfusion.com/documentation/chart/chart-types/spline-area) component in the**~/Components/Pages/SplineChart.razor** page.
2. Then, add the **SplineChart** component within the ** MAUI Grid layout** on the ** MainPage.xaml** page, as shown below.** XAML** ``` ``` ** C#** ``` @using Syncfusion.Blazor.Charts @code { string Width = "100%"; string Height = "100%"; SfChart chart2; string BorderColor = "#2485FA"; string BorderColor2 = "#FEC200"; string FillColor2; string FillColor; public List ChartDataCollection { get; set; } = new List { new ChartData { Period = "Jan", Percentage = 3600 }, new ChartData { Period = "Feb", Percentage = 6200 }, new ChartData { Period = "Mar", Percentage = 8100 }, new ChartData { Period = "Apr", Percentage = 5900 }, new ChartData { Period = "May", Percentage = 8900 }, new ChartData { Period = "Jun", Percentage = 7200 }, new ChartData { Period = "Jul", Percentage = 4300 }, new ChartData { Period = "Aug", Percentage = 4600 }, new ChartData { Period = "Sep", Percentage = 5500 }, new ChartData { Period = "Oct", Percentage = 6350 }, new ChartData { Period = "Nov", Percentage = 5700 }, new ChartData { Period = "Dec", Percentage = 8000 } }; public List ChartDataCollection1 { get; set; } = new List { new ChartData { Period = "Jan", Percentage = 6400,}, new ChartData { Period = "Feb", Percentage = 5300 }, new ChartData { Period = "Mar", Percentage = 4900 }, new ChartData { Period = "Apr", Percentage = 5300 }, new ChartData { Period = "May", Percentage = 4200 }, new ChartData { Period = "Jun", Percentage = 6500 }, new ChartData { Period = "Jul", Percentage = 7900 }, new ChartData { Period = "Aug", Percentage = 3800 }, new ChartData { Period = "Sep", Percentage = 6800 }, new ChartData { Period = "Oct", Percentage = 3400 }, new ChartData { Period = "Nov", Percentage = 6400 }, new ChartData { Period = "Dec", Percentage = 6800 } }; public class ChartData { public string Period { get; set; } public string Product { get; set; } public double Percentage { get; set; } public string TextMapping { get; set; } public string AnnotationX { get; set; } public string AnnotationY { get; set; } public string PointColor { get; set; } } } ```
### Integrating Blazor Area Chart
1. Initialize the [Area Chart](https://blazor.syncfusion.com/documentation/chart/chart-types/area) component in the **~/Components/Pages/AreaChart.razor** page.
2. Add the **AreaChart** component in the ** MAUI Grid layout** on the ** MainPage.xaml** page, as shown below.** XAML** ``` ``` ** C#** ``` @using Syncfusion.Blazor.Charts
OTHERS
STREAMING
DOWNLOAD
COMPACT DISC
CASSETTE
VINYL
8-TRACK
@code { private Theme Theme { get; set; } public string Width { get; set; } = "90%"; public string Size { get; set; } = "11px"; public class AreaChartData { public DateTime Period { get; set; } public double USD { get; set; } } public List Other { get; set; } = new List { new AreaChartData { Period = new DateTime(1988, 01, 01), USD = -0.16 }, new AreaChartData { Period = new DateTime(1989, 01, 01), USD = -0.17 }, new AreaChartData { Period = new DateTime(1990, 01, 01), USD = -0.08 }, new AreaChartData { Period = new DateTime(1992, 01, 01), USD = 0.08 }, new AreaChartData { Period = new DateTime(1996, 01, 01), USD = 0.161 }, new AreaChartData { Period = new DateTime(1998, 01, 01), USD = 0.48 }, new AreaChartData { Period = new DateTime(1999, 01, 01), USD = 1.16 }, new AreaChartData { Period = new DateTime(2001, 01, 01), USD = 0.40 }, new AreaChartData { Period = new DateTime(2002, 01, 01), USD = 0.32 }, new AreaChartData { Period = new DateTime(2003, 01, 01), USD = 0.807 }, new AreaChartData { Period = new DateTime(2005, 01, 01), USD = 1.12 }, new AreaChartData { Period = new DateTime(2006, 01, 01), USD = 1.614 }, new AreaChartData { Period = new DateTime(2008, 01, 01), USD = 1.210 }, new AreaChartData { Period = new DateTime(2009, 01, 01), USD = 1.12 }, new AreaChartData { Period = new DateTime(2011, 01, 01), USD = 0.64 }, new AreaChartData { Period = new DateTime(2013, 01, 01), USD = 0.161 }, new AreaChartData { Period = new DateTime(2018, 01, 01), USD = 0.080 } }; public List Track { get; set; } = new List { new AreaChartData { Period = new DateTime(1973, 01, 01), USD = 2.58 }, new AreaChartData { Period = new DateTime(1975, 01, 01), USD = 2.25 }, new AreaChartData { Period = new DateTime(1977, 01, 01), USD = 3.55 }, new AreaChartData { Period = new DateTime(1978, 01, 01), USD = 2.42 }, new AreaChartData { Period = new DateTime(1981, 01, 01), USD = -0.24 }, new AreaChartData { Period = new DateTime(1982, 01, 01), USD = -0 } }; public List Streaming { get; set; } = new List { new AreaChartData { Period = new DateTime(2011, 01, 01), USD = 0.48 }, new AreaChartData { Period = new DateTime(2013, 01, 01), USD = 1.61 }, new AreaChartData { Period = new DateTime(2015, 01, 01), USD = 2.17 }, new AreaChartData { Period = new DateTime(2017, 01, 01), USD = 7.18 } }; public List Download { get; set; } = new List { new AreaChartData { Period = new DateTime(2004, 01, 01), USD = 0.48 }, new AreaChartData { Period = new DateTime(2007, 01, 01), USD = 1.45 }, new AreaChartData { Period = new DateTime(2012, 01, 01), USD = 2.82 }, new AreaChartData { Period = new DateTime(2013, 01, 01), USD = 2.58 }, new AreaChartData { Period = new DateTime(2015, 01, 01), USD = 2.01 }, new AreaChartData { Period = new DateTime(2016, 01, 01), USD = 1.61 }, new AreaChartData { Period = new DateTime(2017, 01, 01), USD = 0.80 } }; public List Compact { get; set; } = new List { new AreaChartData { Period = new DateTime(1990, 01, 01), USD = 0.69 }, new AreaChartData { Period = new DateTime(1992, 01, 01), USD = 2.86 }, new AreaChartData { Period = new DateTime(1995, 01, 01), USD = 10.2 }, new AreaChartData { Period = new DateTime(1996, 01, 01), USD = 13.0 }, new AreaChartData { Period = new DateTime(1997, 01, 01), USD = 14.35 }, new AreaChartData { Period = new DateTime(1998, 01, 01), USD = 15.17 }, new AreaChartData { Period = new DateTime(1999, 01, 01), USD = 14.89 }, new AreaChartData { Period = new DateTime(2000, 01, 01), USD = 18.96 }, new AreaChartData { Period = new DateTime(2001, 01, 01), USD = 18.78 }, new AreaChartData { Period = new DateTime(2004, 01, 01), USD = 14.25 }, new AreaChartData { Period = new DateTime(2005, 01, 01), USD = 14.24 }, new AreaChartData { Period = new DateTime(2006, 01, 01), USD = 12.34 }, new AreaChartData { Period = new DateTime(2007, 01, 01), USD = 9.34 }, new AreaChartData { Period = new DateTime(2008, 01, 01), USD = 4.45 }, new AreaChartData { Period = new DateTime(2010, 01, 01), USD = 1.46 }, new AreaChartData { Period = new DateTime(2011, 01, 01), USD = 0.64 } }; public List Casette { get; set; } = new List { new AreaChartData { Period = new DateTime(1976, 01, 01), USD = 0.08 }, new AreaChartData { Period = new DateTime(1979, 01, 01), USD = 1.85 }, new AreaChartData { Period = new DateTime(1980, 01, 01), USD = 2.0 }, new AreaChartData { Period = new DateTime(1982, 01, 01), USD = 3.55 }, new AreaChartData { Period = new DateTime(1984, 01, 01), USD = 5.40 }, new AreaChartData { Period = new DateTime(1985, 01, 01), USD = 5.24 }, new AreaChartData { Period = new DateTime(1988, 01, 01), USD = 6.94 }, new AreaChartData { Period = new DateTime(1989, 01, 01), USD = 6.85 }, new AreaChartData { Period = new DateTime(1990, 01, 01), USD = 7.02 }, new AreaChartData { Period = new DateTime(1992, 01, 01), USD = 5.81 }, new AreaChartData { Period = new DateTime(1993, 01, 01), USD = 5.32 }, new AreaChartData { Period = new DateTime(1994, 01, 01), USD = 4.03 }, new AreaChartData { Period = new DateTime(1997, 01, 01), USD = 2.25 }, new AreaChartData { Period = new DateTime(1998, 01, 01), USD = 2.01 }, new AreaChartData { Period = new DateTime(1999, 01, 01), USD = 0.80 }, new AreaChartData { Period = new DateTime(2001, 01, 01), USD = 0.40 } }; public List Vinyl { get; set; } = new List { new AreaChartData { Period = new DateTime(1973, 01, 01), USD = 7.74 }, new AreaChartData { Period = new DateTime(1974, 01, 01), USD = 7.58 }, new AreaChartData { Period = new DateTime(1976, 01, 01), USD = 8.23 }, new AreaChartData { Period = new DateTime(1977, 01, 01), USD = 9.68 }, new AreaChartData { Period = new DateTime(1978, 01, 01), USD = 10.16 }, new AreaChartData { Period = new DateTime(1979, 01, 01), USD = 8.15 }, new AreaChartData { Period = new DateTime(1981, 01, 01), USD = 6.77 }, new AreaChartData { Period = new DateTime(1982, 01, 01), USD = 5.64 }, new AreaChartData { Period = new DateTime(1984, 01, 01), USD = 4.35 }, new AreaChartData { Period = new DateTime(1985, 01, 01), USD = 2.50 }, new AreaChartData { Period = new DateTime(1989, 01, 01), USD = 0.64 }, new AreaChartData { Period = new DateTime(1990, 01, 01), USD = 0 } }; } ```
## Run the .NET MAUI Blazor hybrid app
In the **Visual Studio toolbar**, select the ** Windows Machine** button to build and run the app. Before running the sample, make sure the mode is in ** Windows Machine**.
Refer to the following output image.
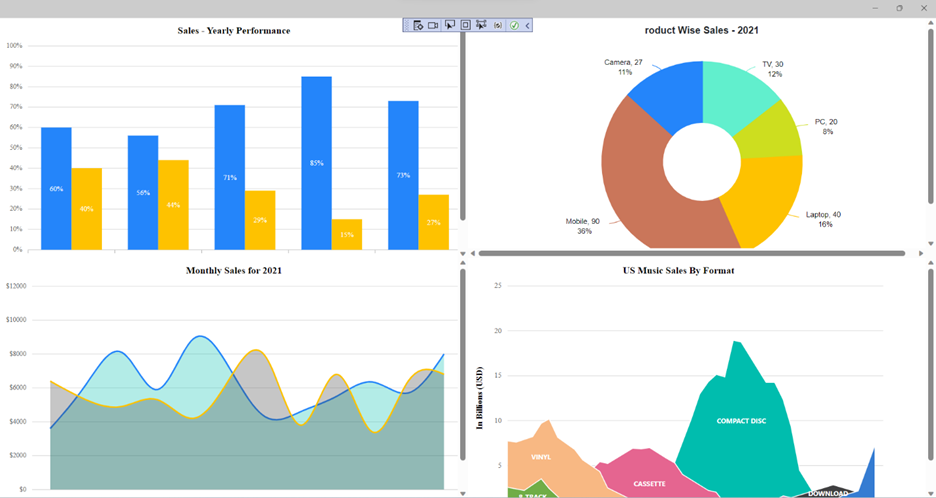
Integrating native Blazor Charts into .NET MAUI Blazor hybrid app
**Note:** To run the app on Android or iOS, refer to the [.NET MAUI getting started](https://learn.microsoft.com/en-us/dotnet/maui/get-started/first-app?tabs=vswin&pivots=devices-android)
documentation.
## GitHub reference
Also, check out [adding Syncfusion Blazor Charts in the .NET MAUI Blazor hybrid app GitHub demo](https://github.com/SyncfusionExamples/Native-UI-components-in-Blazor-hybrid-app)
.
## Summary
Thanks for reading! In this blog, we’ve seen how to seamlessly integrate the [Syncfusion Blazor Charts component](https://www.syncfusion.com/blazor-components/blazor-charts)
in the .NET MAUI Blazor hybrid app. With this, you can also deploy the app to Android, iOS, macOS, and Windows platforms with a single code base. Your feedback is crucial—navigate the steps outlined in this blog and share your insights in the comments section below.
Existing Syncfusion customers can access the new version on the [License and Downloads](https://www.syncfusion.com/account/login)
page. If you’re not a customer, sign up for a [30-day free trial](https://www.syncfusion.com/downloads)
to explore these features firsthand.
You can also contact us through our [support forums](https://www.syncfusion.com/forums)
, [support portal](https://support.syncfusion.com/)
, or [feedback portal](https://www.syncfusion.com/feedback/)
. We are always happy to assist you!
## Related blogs
- [Creating Custom Forms and Validation in a Blazor Hybrid App](https://www.syncfusion.com/blogs/post/blazor-hybrid-app-custom-forms-validation)
- [Exporting DataGrid to PDF Made Easy in .NET MAUI](https://www.syncfusion.com/blogs/post/export-dotnet-maui-datagrid-to-pdf)
- [Easily Create a Directional Compass Using .NET MAUI Radial Gauge](https://www.syncfusion.com/blogs/post/directional-compass-maui-radial-gauge)
- [Create a Modern Conversational UI with the .NET MAUI Chat Control](https://www.syncfusion.com/blogs/post/conversational-ui-dotnet-maui-chat)