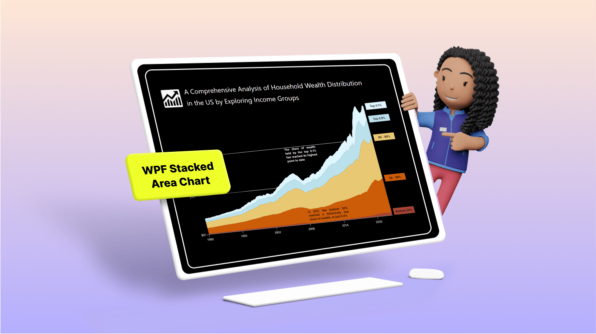
Chart of the Week: Creating a WPF Stacked Area Chart to Visualize Wealth Distribution in the U.S. Arul Jenith Berkmans April 17, 2024
React E-Commerce App for Digital Products: Part 4 (Creating the Home Page) Prashant Yadav April 10, 2024
A Full-Stack Web App Using Angular and GraphQL: Adding Login and Authorization Functionalities (Part 5) Ankit Sharma April 5, 2024
Chart of the Week: Creating a WPF 3D Column Chart to Visualize the Panama Canal’s Shipment Transit Data Surya Karan Raja April 7, 2024
Chart of the Week: Creating a .NET MAUI Column Chart to Visualize the Corporate Investment in AI Saiyath Ali Fathima M March 27, 2024
Streamline Your Progress Navigation with the New .NET MAUI StepProgressBar Muniappan Subramanian March 25, 2024