We use cookies to give you the best experience on our website. If you continue to browse, then you agree to our privacy policy and cookie policy.


Blazor Stock Chart is a well-crafted, easy-to-use financial charting package to track and visualize the stock price of a company over a specific period using charting (candlestick, OHLC, HiLo, etc.) and range tools. Its rich feature set includes zooming, panning, tooltip, crosshair, trackball, period selection, range selection, and events to make stock charts interactive.

Several data rendering optimizations have been used to achieve the best possible efficiency when plotting large amounts of data and managing high-frequency, real-time data.

The Stock Chart for Blazor provides fluid animation to present data with smooth transitions.

The tooltip and crosshair cursor allow users to interact with the chart and obtain detailed information about data points.

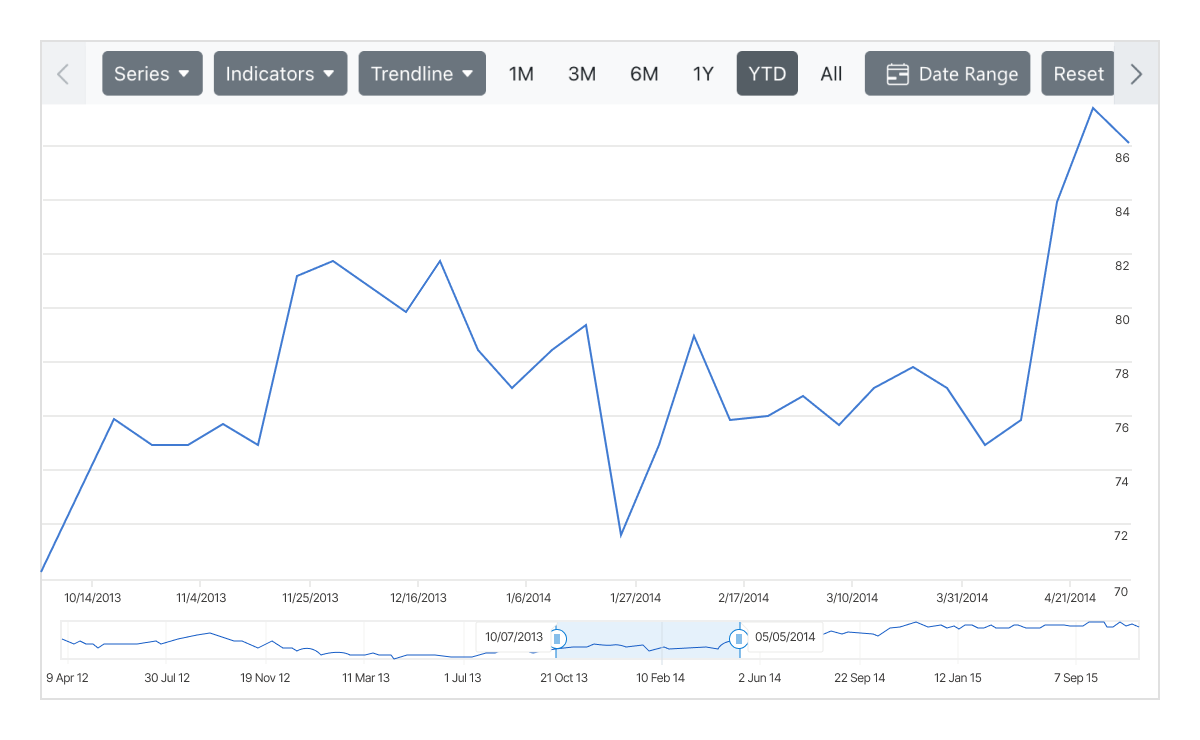
The Blazor Stock Chart supports zooming and panning, multiple series, period selector, range selector, trendlines, and indicators.

Stock Chart has a highly responsive layout and an optimized design for desktops, touchscreens, and phones. It works well on all mobile phones that use iOS, Android, or Windows OS.

Cutting-edge design with several built-in themes, such as Fluent, Tailwind CSS, Bootstrap, Material, and Fabric. Utilize the online Theme Studio tool to customize themes of stock charts easily.

Enable users from different locales to use the control by formatting dates, currency, and numbering to suit preferences.
Easily get started with the Blazor Stock Chart using a few simple lines of C# code as demonstrated below. Also, explore our Blazor Stock Chart example that shows you how to render the Blazor Stock Chart.
@using Syncfusion.Blazor.Charts

<SfStockChart Title="AAPL Historical">
    <StockChartSeriesCollection>
        <StockChartSeries DataSource="@StockDetails" Type="ChartSeriesType.Candle" XName="Date" High="High" Low="Low" Open="Open" Close="Close" Volume="Volume"/>
    </StockChartSeriesCollection>
</SfStockChart>
@code {

    public class ChartData
    {
        public DateTime Date;
        public Double Open;
        public Double Low;
        public Double Close;
        public Double High;
        public Double Volume;
    }

    public List<ChartData> StockDetails = new List<ChartData>
    {
        new ChartData { Date = new DateTime(2012, 04, 02), Open= 85.9757, High = 90.6657,Low = 85.7685, Close = 90.5257,Volume = 660187068},
        new ChartData { Date = new DateTime(2012, 04, 09), Open= 89.4471, High = 92,Low = 86.2157, Close = 86.4614,Volume = 912634864},
        new ChartData { Date = new DateTime(2012, 04, 16), Open= 87.1514, High = 88.6071,Low = 81.4885, Close = 81.8543,Volume = 1221746066},
        new ChartData { Date = new DateTime(2012, 04, 23), Open= 81.5157, High = 88.2857,Low = 79.2857, Close = 86.1428,Volume = 965935749},
        new ChartData { Date = new DateTime(2012, 04, 30), Open= 85.4, High = 85.4857,Low = 80.7385, Close = 80.75,Volume = 615249365},
        new ChartData { Date = new DateTime(2012, 05, 07), Open= 80.2143, High = 82.2685,Low = 79.8185, Close = 80.9585,Volume = 541742692},
        new ChartData { Date = new DateTime(2012, 05, 14), Open= 80.3671, High = 81.0728,Low = 74.5971, Close = 75.7685,Volume = 708126233},
        new ChartData { Date = new DateTime(2012, 05, 21), Open= 76.3571, High = 82.3571,Low = 76.2928, Close = 80.3271,Volume = 682076215},
        new ChartData { Date = new DateTime(2012, 05, 28), Open= 81.5571, High = 83.0714,Low = 80.0743, Close = 80.1414,Volume = 480059584}
   };
}User experience is greatly enhanced by including a set of interactive features such as zooming and panning, crosshair, trackball, events, and selection.


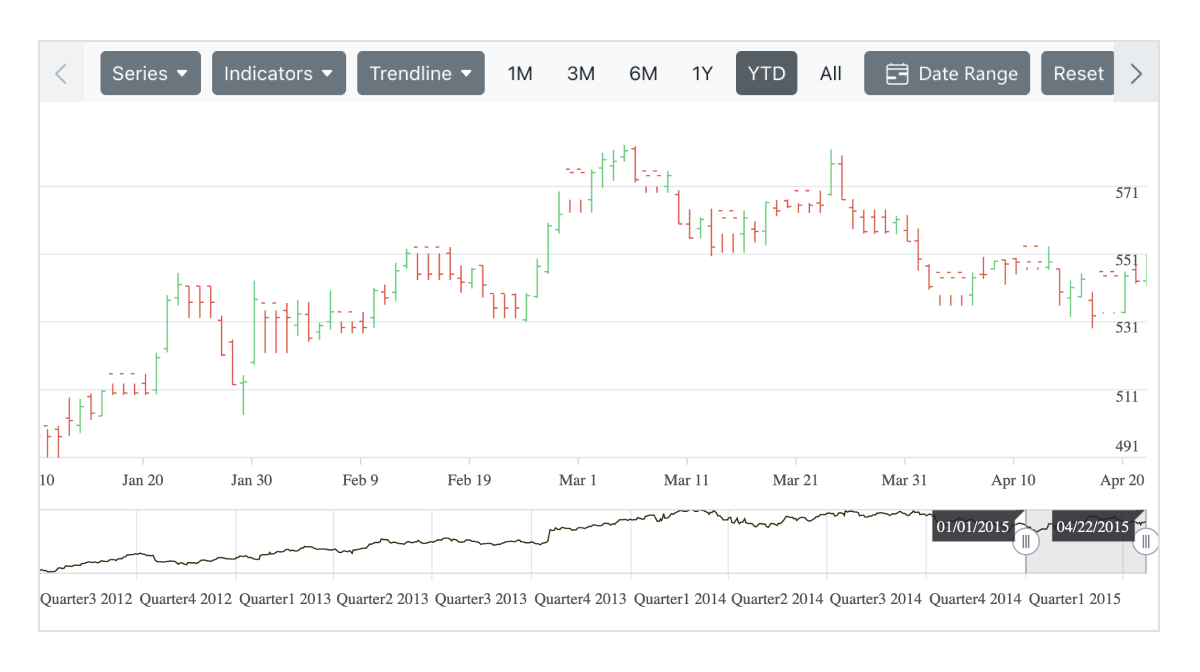
In the Blazor candlestick chart, price action and volume are put together to make an analysis at a glance.
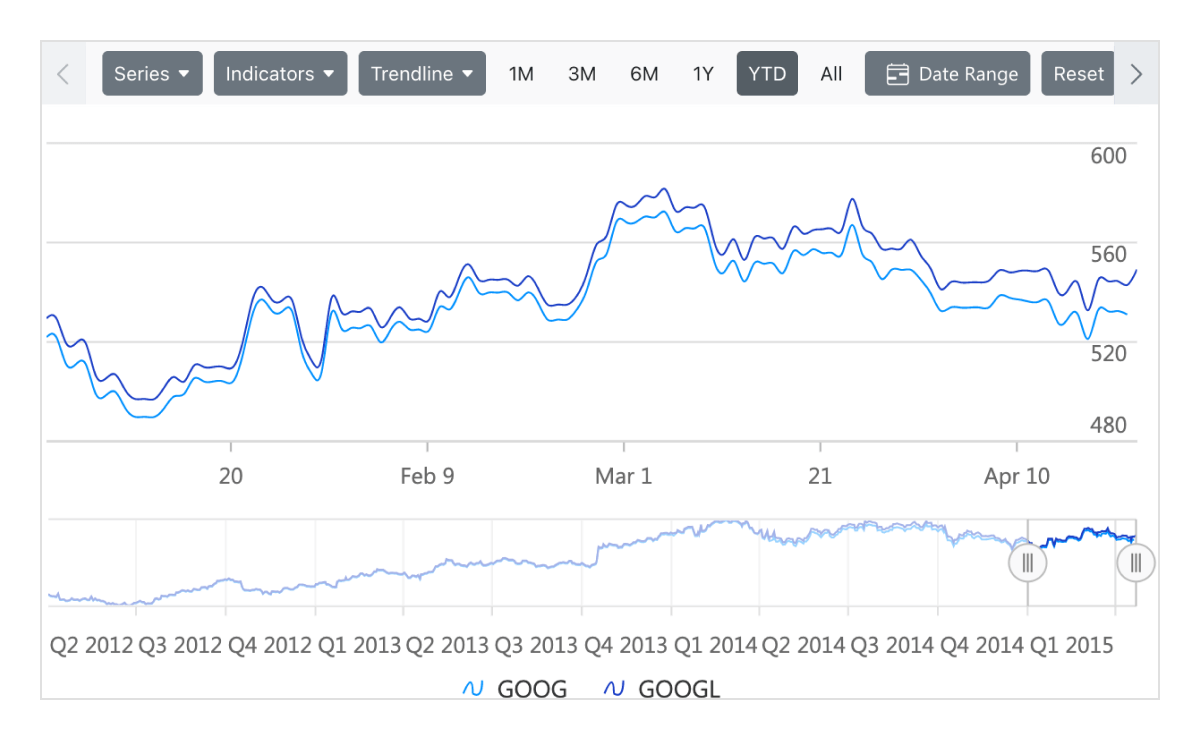
Plot multiple series in a single chart to compare different stock values. Enabling tooltips provide more information about individual series.

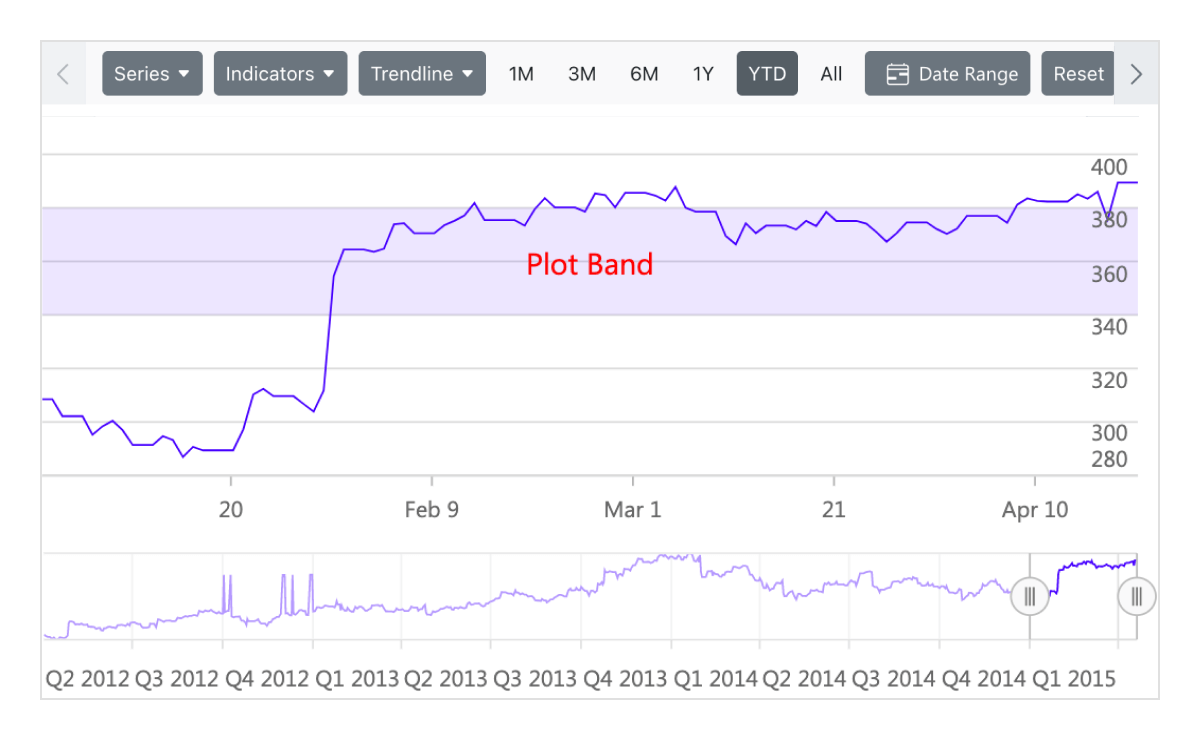
Draw special attention to any region of the chart or graph with the help of strip lines.
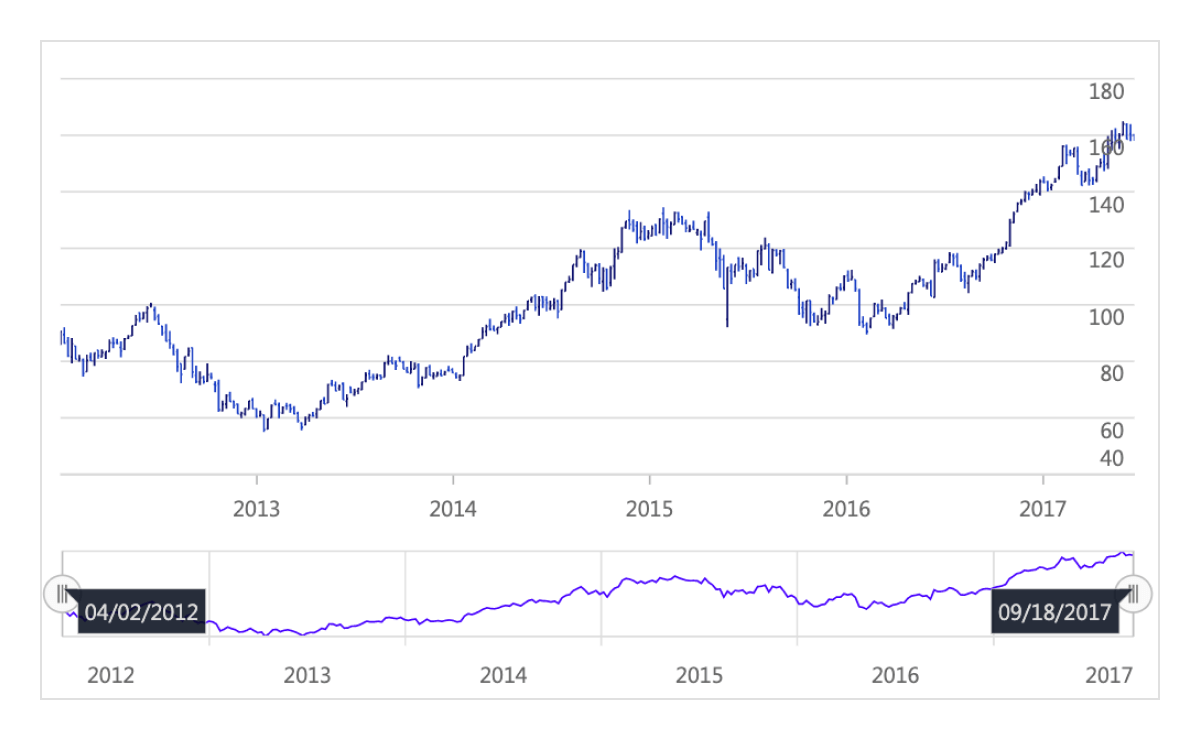
Use range selectors to filter a date range that needs to be visualized within the chart.

Use the period selector to choose a range of data points at predetermined intervals with a single click.
Visualize data using different series types like candle, OHLC, HiLo, line, spline, area, and spline area. The type of the series can be changed using series options in the period selector.
Legends provide additional information helpful in identifying individual data or series in a stock chart.
Use technical indicators to analyze the past and predict future market trends based on historic price, volume, or open interest. Blazor Stock Chart supports 10 types of indicators that can be added using the indicator option in the period selector.


Predict future trends with predetermined data for measurements such as the stock market, target revenue, etc., with the help of trendlines. Add trendlines to the stock chart using the trendline option in the period selector.
Export Blazor Stock Chart to PDF documents or to image formats such as SVG, PNG, and JPEG. Export chart data to XLSX and CSV formats on the client side. Print the rendered stock charts and graphs directly from the browser.

Visualize data using different axis types like numeric, logarithmic, date-time, and date-time category. This chart’s axis elements can be customized further to make an axis more readable.

Every element in Blazor Stock Charts is keyboard accessible. Major features like tooltip, trackball, legend, collapse, zoom, and pan can be used through keyboard commands alone. No mouse interaction is required. This helps in creating highly accessible applications.

The Blazor Stock Chart view has complete WAI-ARIA accessibility support. The Stock Chart UI includes high-contrast visual elements that help visually impaired people to have the best viewing experience. Also, valid UI descriptions are easily accessible through assistive technologies such as screen readers.

Right-to-left rendering allows displaying the text and layout of the Stock Chart from right to left. This improves the user experience and accessibility for RTL languages.
Stock Chart is also available in Angular, React, Vue, and JavaScript frameworks that are built from their own TypeScript libraries. Check out the different Stock Chart platforms from the links below.
The Blazor Stock Chart works well with all modern web browsers, such as Chrome, Firefox, Microsoft Edge, Safari, and Opera.

You can find our Blazor Stock Chart demo here, which demonstrates how to render and configure the Stock Chart.
No, this is a commercial product and requires a paid license. However, a free Community License is also available for companies and individuals whose organizations have less than $1 million USD in annual gross revenue, 5 or fewer developers, and 10 or fewer total employees.
A good place to start would be our comprehensive getting started documentation.


 Documentation
Greatness—it’s one thing to say you have it, but it means more when others recognize it. Syncfusion is proud to hold the following industry awards.


