We use cookies to give you the best experience on our website. If you continue to browse, then you agree to our privacy policy and cookie policy.


The Blazor Gantt Chart is a project planning and management tool that provides a Microsoft Project-like interface to display and manage hierarchical tasks with timeline details. Its intuitive user interface lets you visually manage tasks, resources, and task relationships in a project.

Virtual scrolling in the Blazor Gantt Chart allows you to load large amounts of data without performance degradation.

Bind data seamlessly with various local and remote data sources such as JSON, OData, WCF, and RESTful web services with the help of a data manager.

Gantt Chart has a highly responsive layout and an optimized design for desktops, touchscreens, and phones. It works well on all mobile phones that use iOS, Android, or Windows OS.

The Gantt Chart for Blazor provides fluid animation to present data with smooth transitions.

Template support is used to customize taskbars and grid columns. Customize the timeline header for a better view of the data.

Increase or decrease the width of timeline cells and change the timeline units dynamically with zooming. This lets you clearly view tasks in a project, from minute to decade.

Cutting-edge design with several built-in themes, such as Fluent, Tailwind CSS, Bootstrap, Material, and Fabric. Utilize the online Theme Studio tool to customize themes of gantt chart easily.

Enable users from different locales to use the control by formatting dates, currency, and numbering to suit preferences.
Easily get started with the Blazor Gantt Chart using a few simple lines of C# code as demonstrated below. Also explore our Blazor Gantt Chart Example that shows you how to render and configure the Blazor Gantt Chart.
@using Syncfusion.Blazor.Gantt
<SfGantt DataSource="@TaskCollection" Height="450px" Width="700px">
</SfGantt>

@code{
public List<TaskData> TaskCollection { get; set; }
protected override void OnInitialized()
{
this.TaskCollection = GetTaskCollection();
}

public class TaskData
{
public int TaskId { get; set; }
public string TaskName { get; set; }
public DateTime StartDate { get; set; }
public DateTime EndDate { get; set; }
public string Duration { get; set; }
public int Progress { get; set; }
public List<TaskData> SubTasks { get; set; }
}

public static List <TaskData> GetTaskCollection() {
List <TaskData> Tasks = new List <TaskData> () {
    new TaskData() {
        TaskId = 1,
        TaskName = "Project initiation",
        StartDate = new DateTime(2019, 04, 02),
        EndDate = new DateTime(2019, 04, 21),
        SubTasks = (new List <TaskData> () {
            new TaskData() {
                TaskId = 2,
                TaskName = "Identify Site location",
                StartDate = new DateTime(2019, 04, 02),
                Duration = "4",
                Progress = 50,
            }
        })
    }
};
return Tasks;
}
}The Blazor Gantt Chart supports different configurable timeline views: hour, day, week, month, and year.

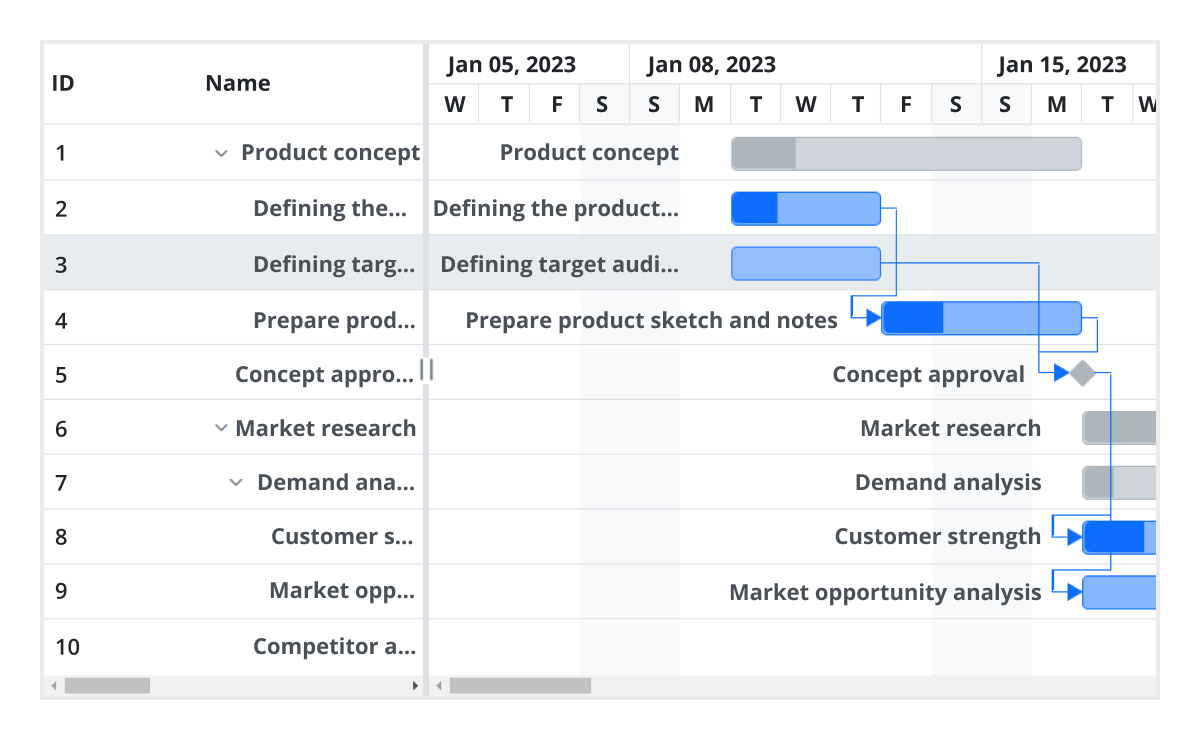
Create relationships among different tasks to determine the execution order using finish-to-start, start-to-finish, start-to-start, and finish-to-finish task link types.
Rows in Gantt Chart represents each tasks or data object information from the data source. It supports expanding / collapsing child rows, reordering of rows, indent / outdent rows to change its hierarchy levels and much more features.


Columns define the schema of a data source in Blazor Gantt Chart. It supports formatting, column definitions, column chooser, column menu, column reordering, and other important features.
The Blazor Gantt Chart allows user to sort a column in either ascending or descending order by simply clicking on the header. A Ctrl + header click performs multi-sorting.


Data across all columns can be filtered using the menu filtering and toolbar search options.
Edit the tasks fields directly in their respective cells using a dialog or interactively using taskbars. Enable and disable the Gantt editing operations with the read-only option.
Blazor Gantt Chart allows users to select rows or cells by simply clicking on them. More than one row or cell can be selected by holding the Ctrl or Shift key, or programmatically. A range of cells can be selected by dragging the pointer over cells. This helps to copy the selected rows or cells in the clipboard.
Focus on the tasks that are not visible but scheduled later along the timeline by selecting their rows in the grid section.


Highlight important days or events in a project using event markers.
Use toolbar options for editing, searching, expanding, collapsing, and deleting selected tasks along with an option for adding a new task.


Compare the current task’s progress with the planned timeline using baselines.
Allocate multiple resources like staff, equipment, and materials to each task.


Display events for a specific task that can be placed on the timeline on any given date.
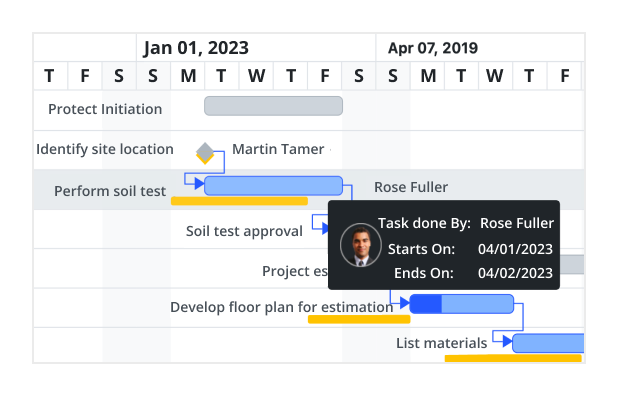
The tooltip displays task information while the mouse hovers over the task and editing actions for the taskbar and connector lines.

Row height is a major factor when displaying records in the view port and it can be customized effortlessly based on the application’s UI requirement. The height of child taskbars and parent taskbars can be customized using the taskbarHeight property.

The context menu improves user action with Blazor Gantt Chart component using a pop-up menu. It appears when a cell or header is right clicked. In addition to built-in default menu items, it allows you to add custom context menu items.

Easily export the Blazor Gantt Chart component in file formats such as Excel or CSV.

The Blazor Gantt Chart ensures that every cell is accessible using the keyboard. Major features like sorting, selection, and editing can be performed using keyboard commands alone; no mouse interaction required. This helps in creating highly accessible applications using this component.

The Blazor Gantt Chart has complete WAI-ARIA accessibility support. The Gantt Chart UI includes high-contrast visual elements, helping visually impaired people have the best viewing experience. Also, the valid UI descriptions are easily accessible through assistive technologies such as screen readers.
The Blazor Gantt Chart has a highly responsive layout and a fine touch-interactions support for desktops, touch screens, and smart phones.

User-friendly touch gestures and an interactive UI design help produce the best user experience. All Gantt Chart features work on touch devices with zero configuration.

The responsive feature allows the Blazor Gantt Chart layout to be viewed on various devices. It is also possible to hide specific columns for particular screen sizes using column-based media query support.
Gantt Chart is also available in Angular, React, Vue, and JavaScript frameworks that are built from their own TypeScript libraries. Check out the different Gantt Chart platforms from the below links,
The Blazor Gantt Chart works well with all modern web browsers such as Chrome, Firefox, Microsoft Edge, Safari, and Opera.

The Syncfusion Gantt Chart is a best blazor project management tool with the following features:
You can find our Blazor Gantt Chart demo, which demonstrates how to render and configure the Gantt Chart.
No, this is a commercial product and requires a paid license. However, a free community license is also available for companies and individuals whose organizations have less than $1 million USD in annual gross revenue, 5 or fewer developers, and 10 or fewer total employees.
A good place to start would be our comprehensive getting started documentation.


 Documentation
Greatness—it’s one thing to say you have it, but it means more when others recognize it. Syncfusion is proud to hold the following industry awards.


