We use cookies to give you the best experience on our website. If you continue to browse, then you agree to our privacy policy and cookie policy.

Blazor Line Chart represents and visualizes the time-dependent data to show the trends at equal intervals. Works well with large amount of data with smooth animation, zooming, and panning support.

Bind data seamlessly with various local and remote data sources such as JSON, RESTful services, OData services, and WCF services. The Blazor Line Chart uses the data manager for binding the data source.
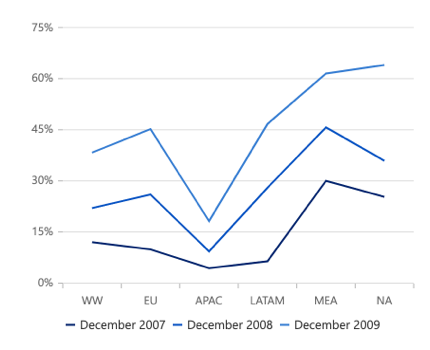
Blazor Line Chart allows you to plot multiple series in a single chart to compare different data sets. Enabling legend and tooltip gives more information about the individual series.
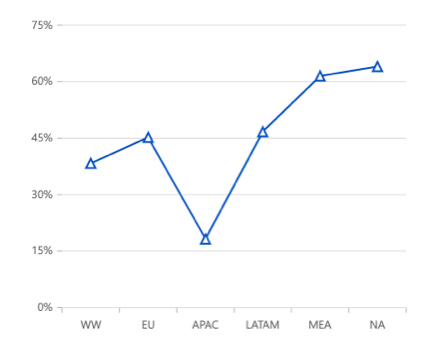
Marks data points with built-in shapes such as circles, rectangles, ellipses, vertical lines, horizontal lines, diamonds, triangles, pluses, crosses, and pentagons. In addition to these shapes, use images to make the point more attractive.
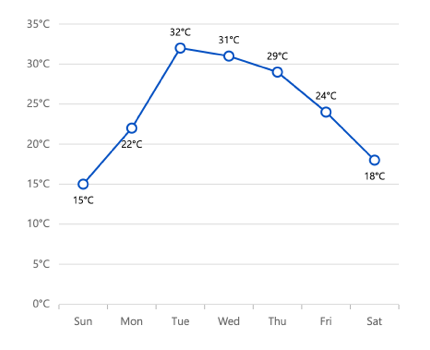
Data labels display information about data points. Add a template to display data labels with HTML elements such as images, DIV, and spans for more informative data labels. You can rotate a data label by its given angle in blazor line chart.
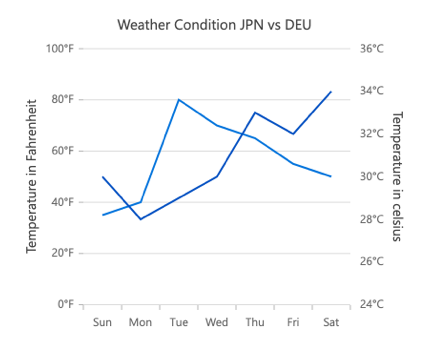
Use multiple axes to plot different data sets that widely vary from one other.
Enable zooming and panning support in Blazor Line Chart when dealing with large amount of data to visualize the data point in any region.
Create and update the Blazor Line Chart with live data that changes over seconds or minutes.
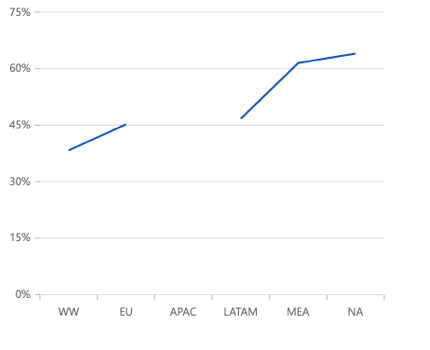
Handle the missed data elegantly with empty points support.
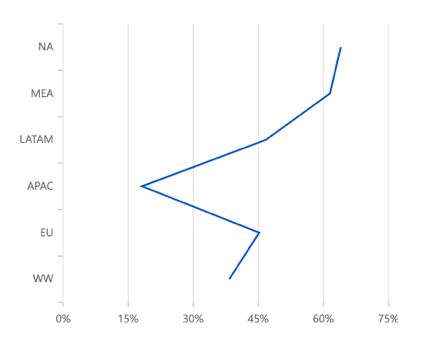
The Blazor Line Chart can be transposed vertically to view the data in a different perspective.
You can combine Blazor Line Chart and other different types of chart series. Legend and tooltip for the series make it more readable.
Customize the color, thickness, and dash array of the Blazor Line Chart using built-in APIs.
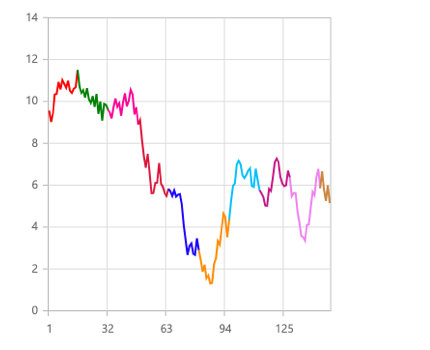
Blazor line chart is used to represent time-dependent data to show the trends at equal intervals with their individual colors by using PointColorMapping.
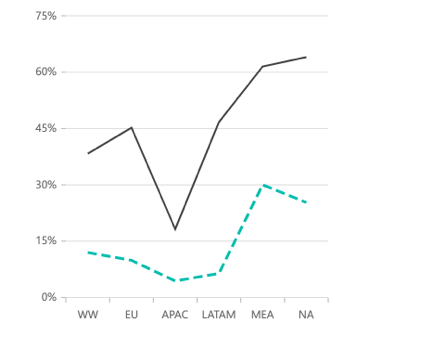
Use DashArray, Width, Fill properties to customize the line as dashed line.
Easily get started with Blazor Line Chart using a few simple lines of C# code, as demonstrated below. Also explore our Blazor Line Chart Example that shows you how to render and configure the Line Chart in Blazor.
@using Syncfusion.Blazor.Charts

<SfChart>
   <ChartPrimaryXAxis ValueType="Syncfusion.Blazor.Charts.ValueType.Category"/>
    <ChartSeriesCollection>
        <ChartSeries DataSource="@MedalDetails" XName="X" YName="Y" Type="ChartSeriesType.Line">
        </ChartSeries>
    </ChartSeriesCollection>
</SfChart>

@code
{
    public class ChartData
    {
        public string X { get; set; }
        public double Y { get; set; }
    }
    public List<ChartData> MedalDetails = new List<ChartData>
    {
         new ChartData { X= "South Korea", Y= 39.4 },
        new ChartData { X= "India", Y= 61.3 },
        new ChartData { X= "Pakistan", Y= 20.4 },
        new ChartData { X= "Germany", Y= 65.1 },
        new ChartData { X= "Australia", Y= 15.8 },
        new ChartData { X= "Italy", Y= 29.2 },
        new ChartData { X= "United Kingdom", Y= 44.6 },
        new ChartData { X= "Saudi Arabia", Y= 9.7 },
        new ChartData { X= "Russia", Y= 40.8 },
        new ChartData { X= "Mexico", Y= 31 },
        new ChartData { X= "Brazil", Y= 75.9 },
        new ChartData { X= "China", Y= 51.4 }
    };
}
 You are using an outdated version of Internet Explorer that may not display all features of this and other websites. Upgrade to Internet Explorer 8 or newer for a better experience.