We use cookies to give you the best experience on our website. If you continue to browse, then you agree to our privacy policy and cookie policy.

The end-user experience is greatly enhanced by including a set of user interaction features such as zooming and panning, crosshair, trackball, drill-down, events, and tooltip. You can configure these interactive chart features using the built-in APIs.
Visualize data points in any region of the chart by zooming the region.
Zoom in and zoom out the chart through mouse wheel scrolling or through pinch gesture in touch enabled device or by using the rubber band selection.
Zoom the chart along the horizontal axis, vertical axis, or both axes.
Perform zoom in, zoom out, pan, and reset actions quickly using zoom toolbar commands. The toolbar can be displayed initially along with the chart or on demand depending on preferences.
Add a scrollbar for the chart to pan or zoom the chart further.
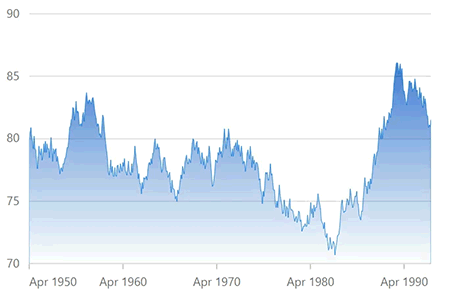
Inspect or target any data point on mouse moves with the help of a crosshair. A thin horizontal line and a vertical line indicate the data point with the information displayed in an interactive tooltip.
Track data points that are close to the mouse position or touch contact. Trackballs display information about pop-up data with more customizable options.
Use the Blazor interactive chart tooltips to show information about the data points on mouse hover.
Users can synchronize tooltip, zooming and panning, crosshair, and selection features across multiple charts.
Select data points in a series for easy understanding of the selected data. Adding pattern and color to the selected data makes charts more interactive.
Select a point in a series. Adding pattern and color to the selected data makes charts more interactive.
Select a series from the chart series collection. Adding pattern and color to the selected series makes charts more interactive.
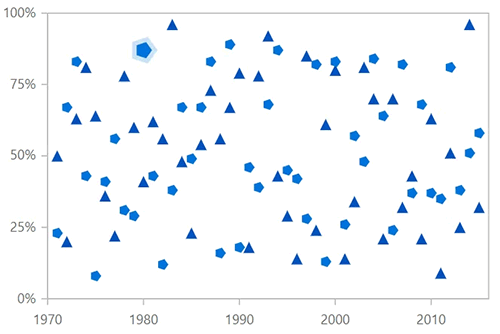
Select a cluster of points from the series with a mouse click.
Users can select multiple points and series in a chart. Adding patterns and colors to the selected data makes the charts more interactive.
Users can select a region with respect to both horizontal and vertical axes.

Users can select a region by drawing freehand shapes.
 You are using an outdated version of Internet Explorer that may not display all features of this and other websites. Upgrade to Internet Explorer 8 or newer for a better experience.