
This blog post discusses how to create a Technical Indicator by using JavaScript Chart. Technical Indicators forecast the direction of prices in Financial sectors through the study of past market data, primarily price and volume. There are more than ten widely used technical indicators, but we will discuss how to create a Simple Moving Average (SMA) technical indicator here.
Before we start, you must understand the calculation behind creating a Simple Moving Average technical indicator. Financial Charts—apart from focusing on the price and volume—also focus on the high, low, opening, and closing prices of a certain period. For this reason, we need to take into account these values while creating a technical indicator. The following list shows the required data for SMA calculation:
· Date
· High (Double)
· Low (Double)
· Open (Double)
· Close (Double)
Let us consider the following JSON Data Collection for SMA Calculation.
window.chartData = [
{"xDate": new Date(2011,7,28), "Open":22.91, "High":23.06, "Low":22.52, "Close":22.56},
{"xDate": new Date(2011,7,29), "Open":22.38, "High":22.64, "Low":22.05, "Close":22.25},
{"xDate": new Date(2011,8,1), "Open":22.41, "High":22.46, "Low":21.76, "Close":21.95},
{"xDate": new Date(2011,8,2), "Open":21.78, "High":22.19, "Low":21.2, "Close":21.21},
{"xDate": new Date(2011,8,3), "Open":21.18, "High":21.4, "Low":20.72, "Close":21.34},
{"xDate": new Date(2011,8,4), "Open":21.04, "High":21.14, "Low":20.14, "Close":20.15},
{"xDate": new Date(2011,8,5), "Open":20.29, "High":20.49, "Low":19.03, "Close":20},
…
…
…
]
Now that the data is ready, we can start creating an SMA.
Simple Moving Average (SMA)
Firstly, to create a Simple Moving Average technical indicator, we must compute the average of prices over a specific period of time. This period can range from two days to an infinite number of days.
Calculation
Daily Closing Prices: 1,2,3,4,5,6,7
First day of 5-day SMA: (1 + 2 + 3 + 4 + 5) / 5 = 3
Second day of 5-day SMA: (2 + 3 + 4 + 5 + 6) / 5 = 4
Third day of 5-day SMA: (3 + 4 + 5 + 6 + 7) / 5 = 5
Notice that each SMA value is lesser than the last price. For example, the SMA value for the first day is three and the last price is five. As the prices prior four days are lesser, this causes the SMA to lag.
Secondly, let us learn how to compute SMA points of data. To start with, let us create an array “smaPoints”, and use the CalculateSMAPoints method to store the values in the array. The following code example illustrates this.
var smaPoints[];
function CalulateSMAPoints(movingAveragePeriod)
{

  var sum = 0.0;
  var limit = chartData.length;
  var length = Math.round(movingAveragePeriod);
  for (var i = 0; i < length; i++)
  smaPoints[i] = { "X": chartData[i].xDate, "Y": chartData[i].Close };
  for (var i = 0; i < limit; ++i)
  {
    if (i >= length - 1 && i < limit)
    {
      if (i - movingAveragePeriod >= 0)
      {
        sum += chartData[i].Close - chartData[i - length].Close;
      }
      else
      {
        sum += chartData[i].Close;
      }
      smaPoints[i] = { "X": chartData[i].xDate, "Y": sum / movingAveragePeriod

      };
    }
    else
    {
      if (i < movingAveragePeriod - 1)
      sum += chartData[i].Close;
    }
  }
}
After computing the SMA points in a separate Array collection, you can set this collection as the data source to a Line Series as shown in the following code example.
$(function()
{
  $("#container").ejChart(
  {
    series: [
    {
      name: 'Series 1', type: 'candle',
      animation: false,
      dataSource :{ data: window.indicatorData, xName: "xDate", high: "High",

      open: "Open", low: "Low", close: "Close" }
    },
    {
      name: 'SMA 5', type: 'line',
      style: { interior: "#01D002" },
      animation: false,
      dataSource :{ data: smaPoints, xName: "X", yName: "Y"}
    },
    {
      name: ''SMA 25', type: 'line',
      style: { interior: "#6501F5" },
      animation: false,
      dataSource :{ data: smaPoints, xName: "X", yName: "Y"}
    },
    {
      name: ''SMA 50', type: 'line',
      style: { interior: "lightblue" },
      animation: false,
      dataSource :{ data: smaPoints, xName: "X", yName: "Y"}

    }],
  });
});
In the preceding code, you will be able to see four Chart Series (one Candle Series and three Line Series). The Line Series indicate SMA indicator values over a period of 5, 25, and 50 days.
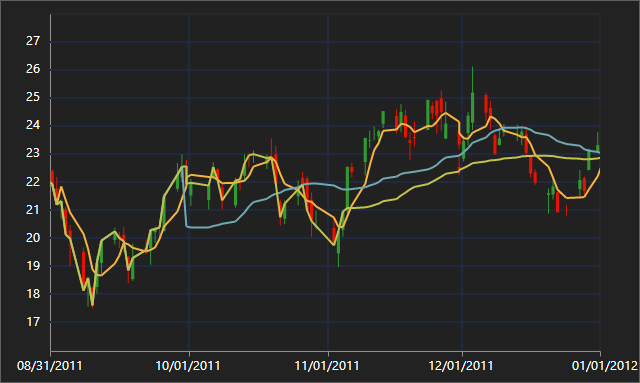
Sales Analysis with SMA Indicator
To help you replicate what you just learned, we have also provided a sample you can download here.
Content Contributor: Michael Prabhu Content Editor: GeeGee Inekeya


